Quickstart
This guide provides instructions on monitoring an AI solution through the Radicalbit AI Platform.
Inside the platform, three models are already included: one binary classificator, one multiclass classificator, and one regressor. If you would like to see how to create them from scratch, see Radicalbit Platform Python SDK Examples: the corresponding notebooks can be found here.
In this quickstart, we are going to use the GUI to create a binary classificator for monitoring an LLM.
Monitor an LLM for a Binary Classification
The use case we present here involves the usage of an LLM (powered with RAG) capable of generating an answer to the user's questions in a chatbot for banking services.
Introduction
The model returns two different outputs:
model_answer: the answer generated by retrieving similar informationprediction: a boolean value that indicates if the user's question is pertinent to banking topics.
The reason for this information lies in the fact that by discriminating the textual data into categories, the bank will be able to use only the information related to banking services, to fine-tune the model in a second moment and improve its performance.
Model Creation
To use the radicalbit-ai-monitoring platform, you need first to prepare your data, which should include the following information:
- Features: The list of variables used by the model to produce the inference. They may include also meta-data (timestamp, log)
- Outputs: The fields returned by the model after the inference. Usually, they are probabilities, a predicted class or number in the case of the classic ML, and a generated text in the case of LLMs.
- Target: the ground truth used to validate predictions and evaluate the model quality
This tutorial involves batch monitoring, including the situation where you have some historical data that you want to compare over time.
The reference dataset is the name we use to indicate the batch that contains the information we desire to have constant (or we expect to have) over time. It could be the training set or a chunk of production data where the model has had good performances.
The current dataset is the name we use to indicate the batch that contains fresh information, for example, the most recent production data, predictions, or ground truths. We expect that it has the same characteristics (statistical properties) as the reference, which indicates that the model has the performance we expect and there is no drift in the data.
What follows is an example of data we will use in this tutorial:
| timestamp | user_id | question | model_answer | ground_truth | prediction | gender | age | device | days_as_customer |
|---|---|---|---|---|---|---|---|---|---|
| 2024-01-11 08:08:00 | user_24 | What documents do I need to open a business account? | You need a valid ID, proof of address, and business registration documents. | 1 | 1 | M | 44 | smartphone | 194 |
| 2024-01-10 03:08:00 | user_27 | What are the benefits of a premium account? | The benefits of a premium account include higher interest rates and exclusive customer support. | 1 | 1 | F | 29 | tablet | 258 |
| 2024-01-11 12:22:00 | user_56 | How can I check my credit score? | You can check your credit score for free through our mobile app. | 1 | 1 | F | 44 | smartphone | 51 |
| 2024-01-10 04:57:00 | user_58 | Are there any fees for using ATMs? | ATM usage is free of charge at all locations. | 1 | 1 | M | 50 | smartphone | 197 |
- timestamp: it is the time at which the user asks the question;
- user_id: it is the user identification;
- question: it is the question asked by the user to the chatbot;
- model_answer: it is the answer generated by the model;
- ground_truth: it is the real label where 1 stands for an answer related to banking services and 0 stands for a different topic;
- prediction: it is the judgment produced by the model about the topic of the answer;
- gender: it is the user's gender;
- age: it is the user's age;
- device: it is the device used in the current session;
- days_as_customer: it indicates how many days the user is a customer.
Create the Model
To create a new model, navigate to the Models section and click the plus (+) icon.
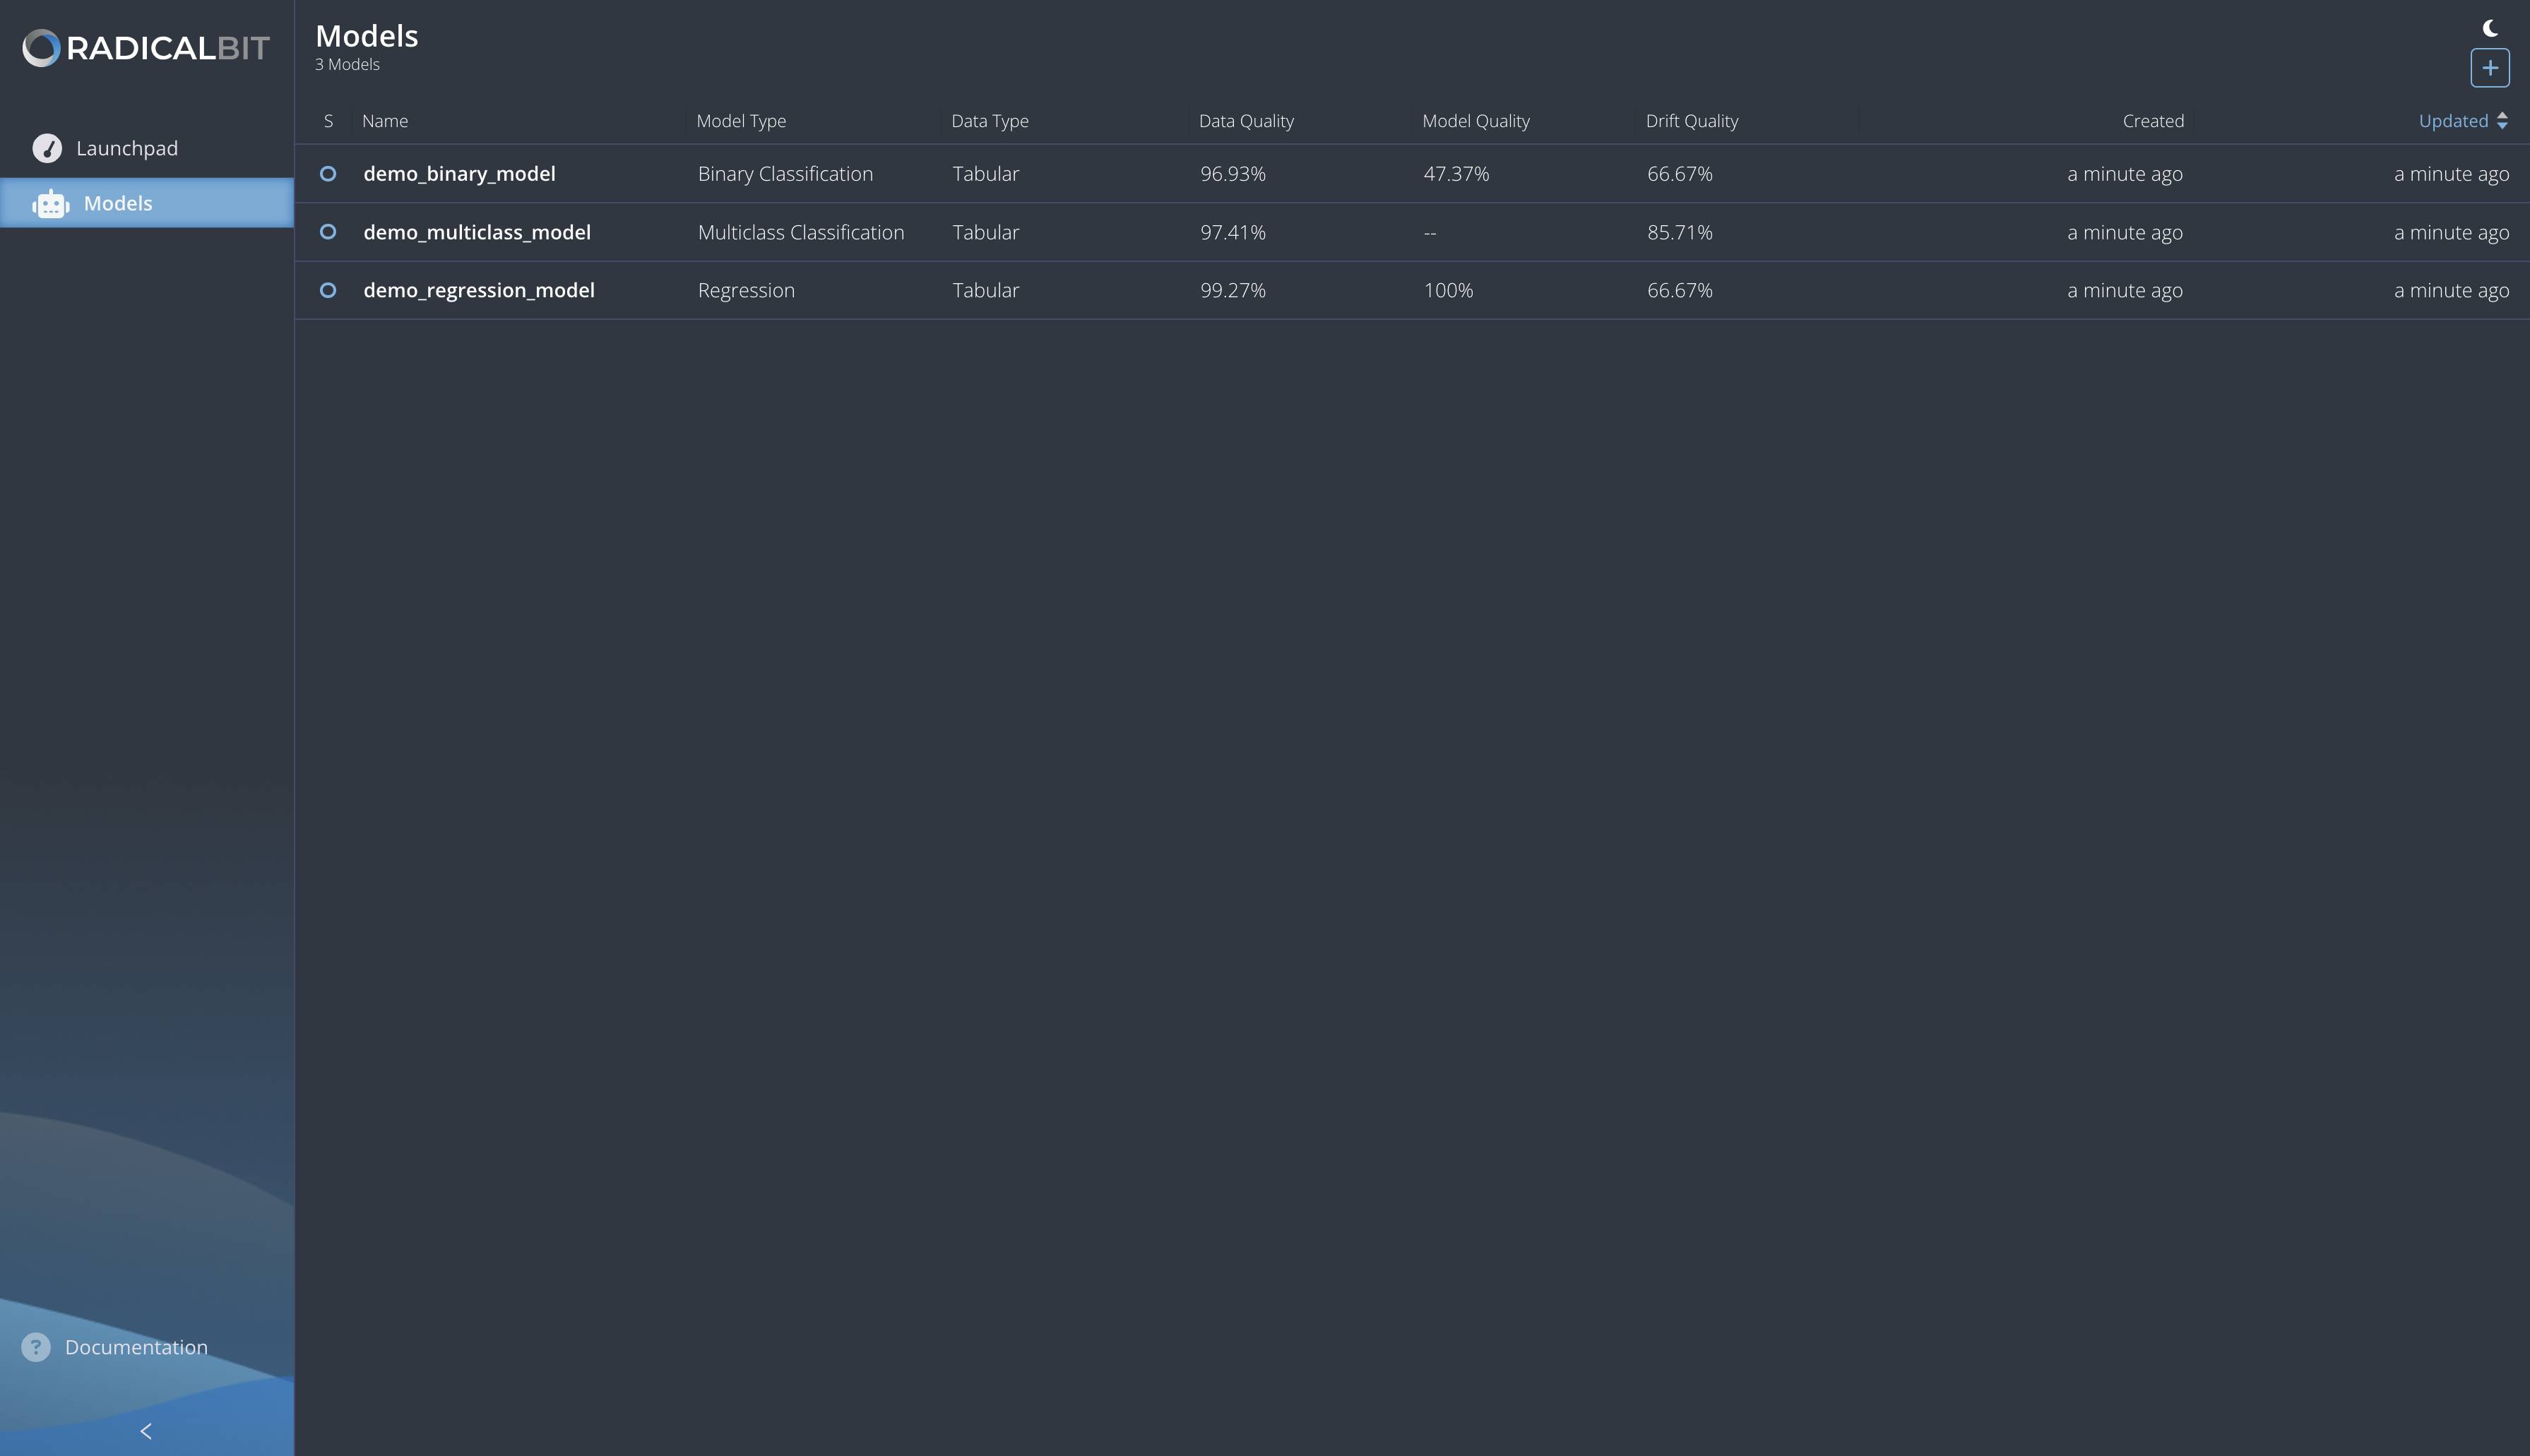
The platform should open a modal to allow users to create a new model.
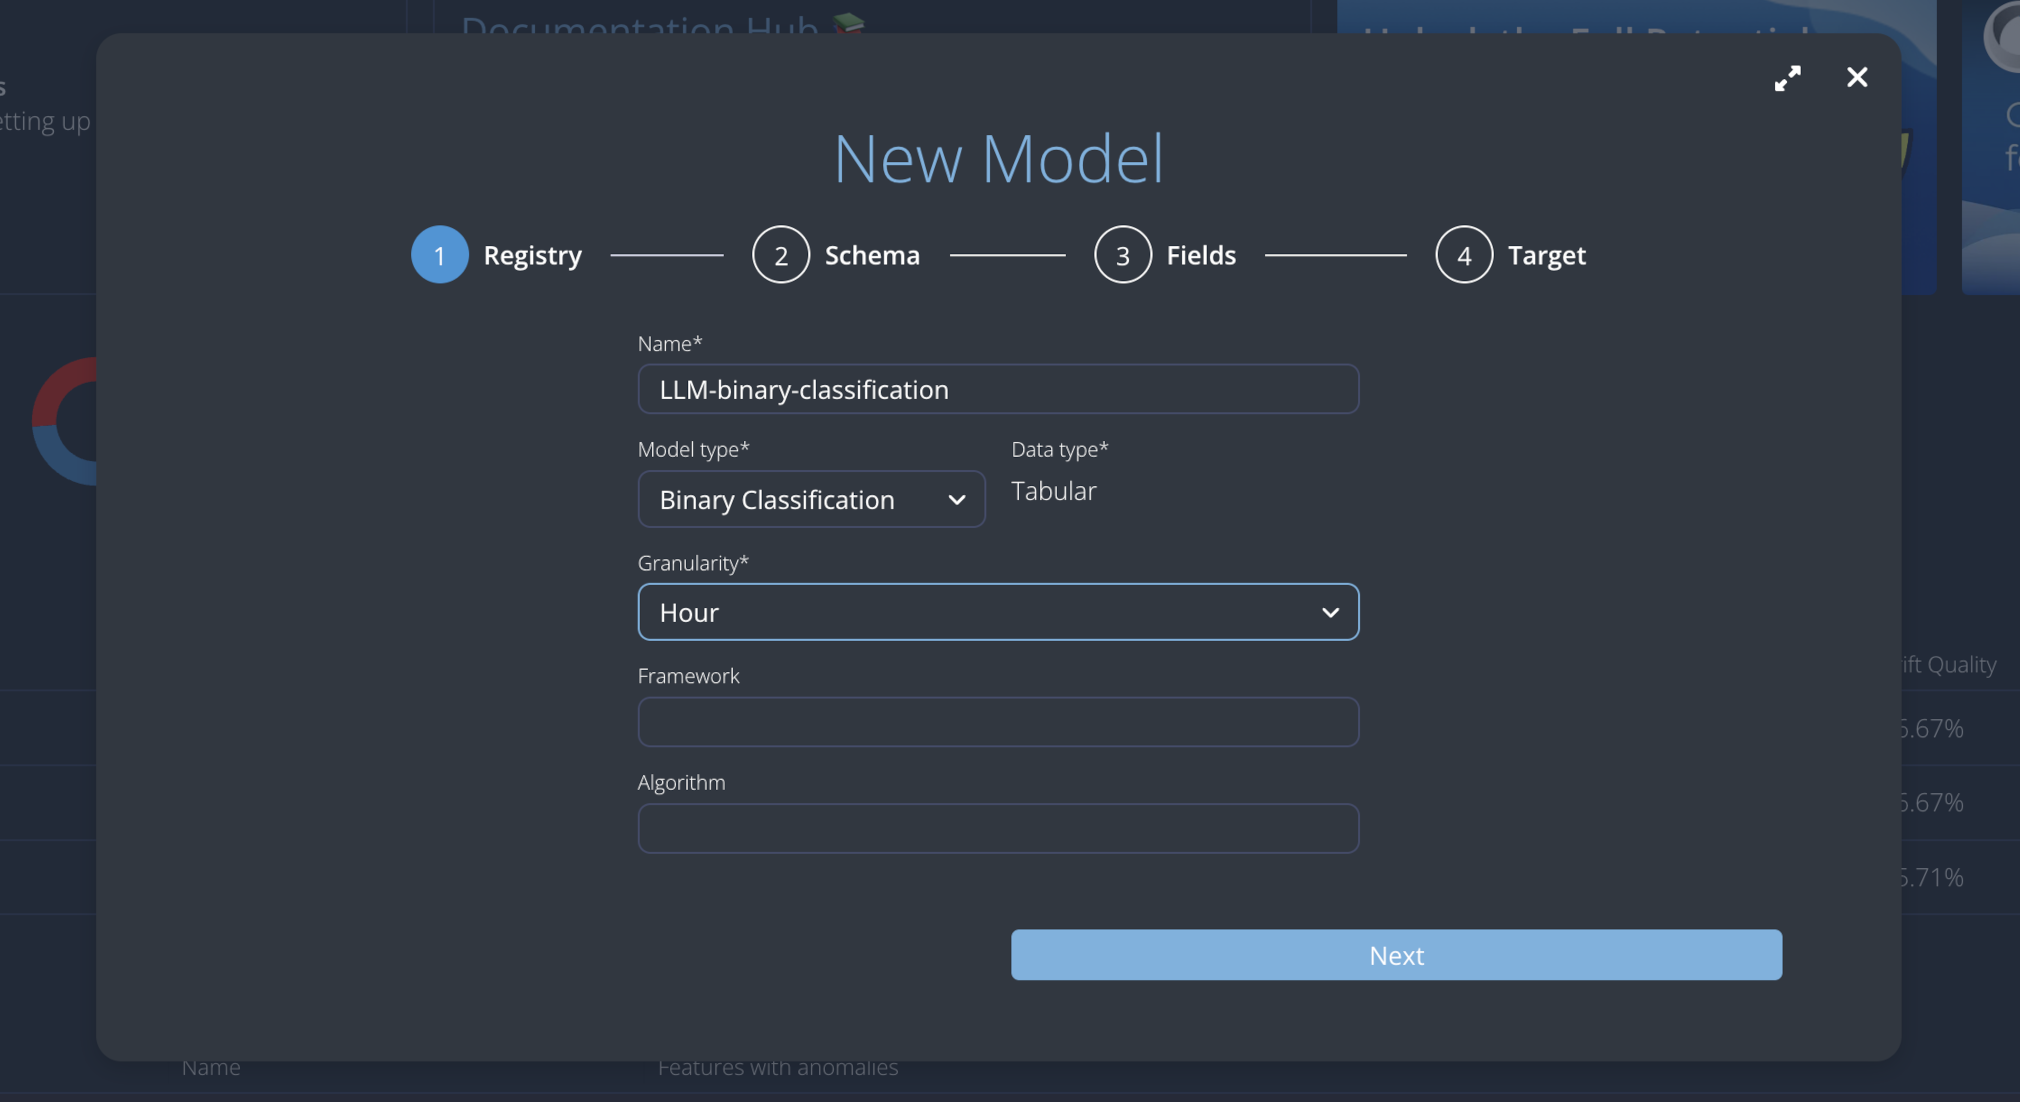
This modal prompts you to enter the following details:
- Name: the name of the model;
- Model type: the type of the model;
- Data type: it explains the data type used by the model;
- Granularity: the window used to calculate aggregated metrics;
- Framework: an optional field to describe the frameworks used by the model;
- Algorithm: an optional field to explain the algorithm used by the model.
Please enter the following details and click on the Next button:
- Name:
LLM-binary-classification; - Model type:
Binary Classification; - Data type:
Tabular; - Granularity:
Hour;
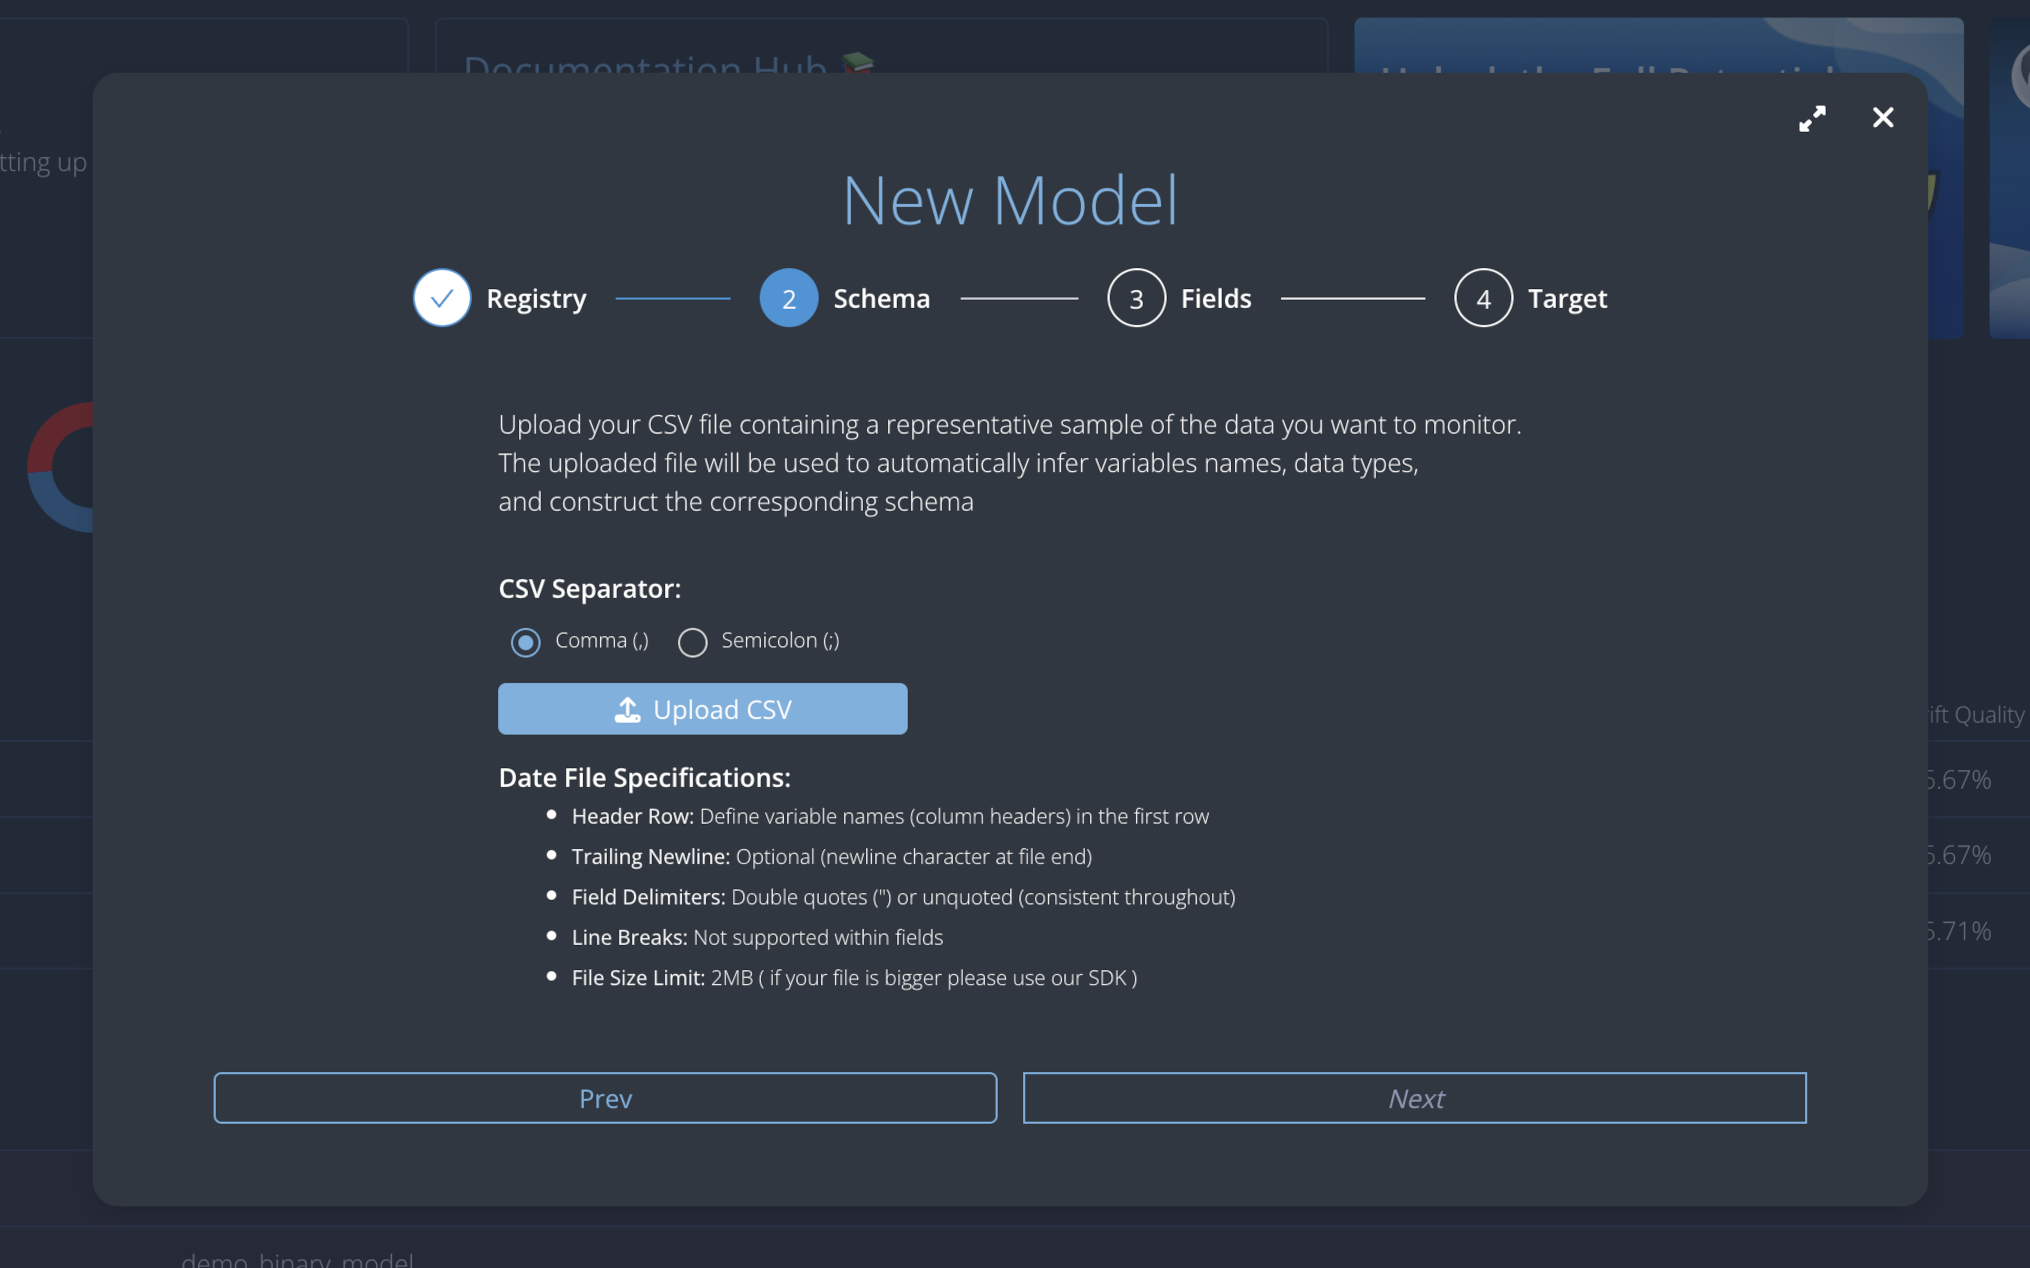
To infer the model schema you have to upload a sample dataset. Please download and use this reference Comma-Separated Values file and click on the Next button.
Since in the CSV file there might be useless fields, e.g. some uuid which would be pointless to analyse, choose which fields you want to carry over: in the case select all of them, click on the arrow to transfer them, and then click on the Next button.
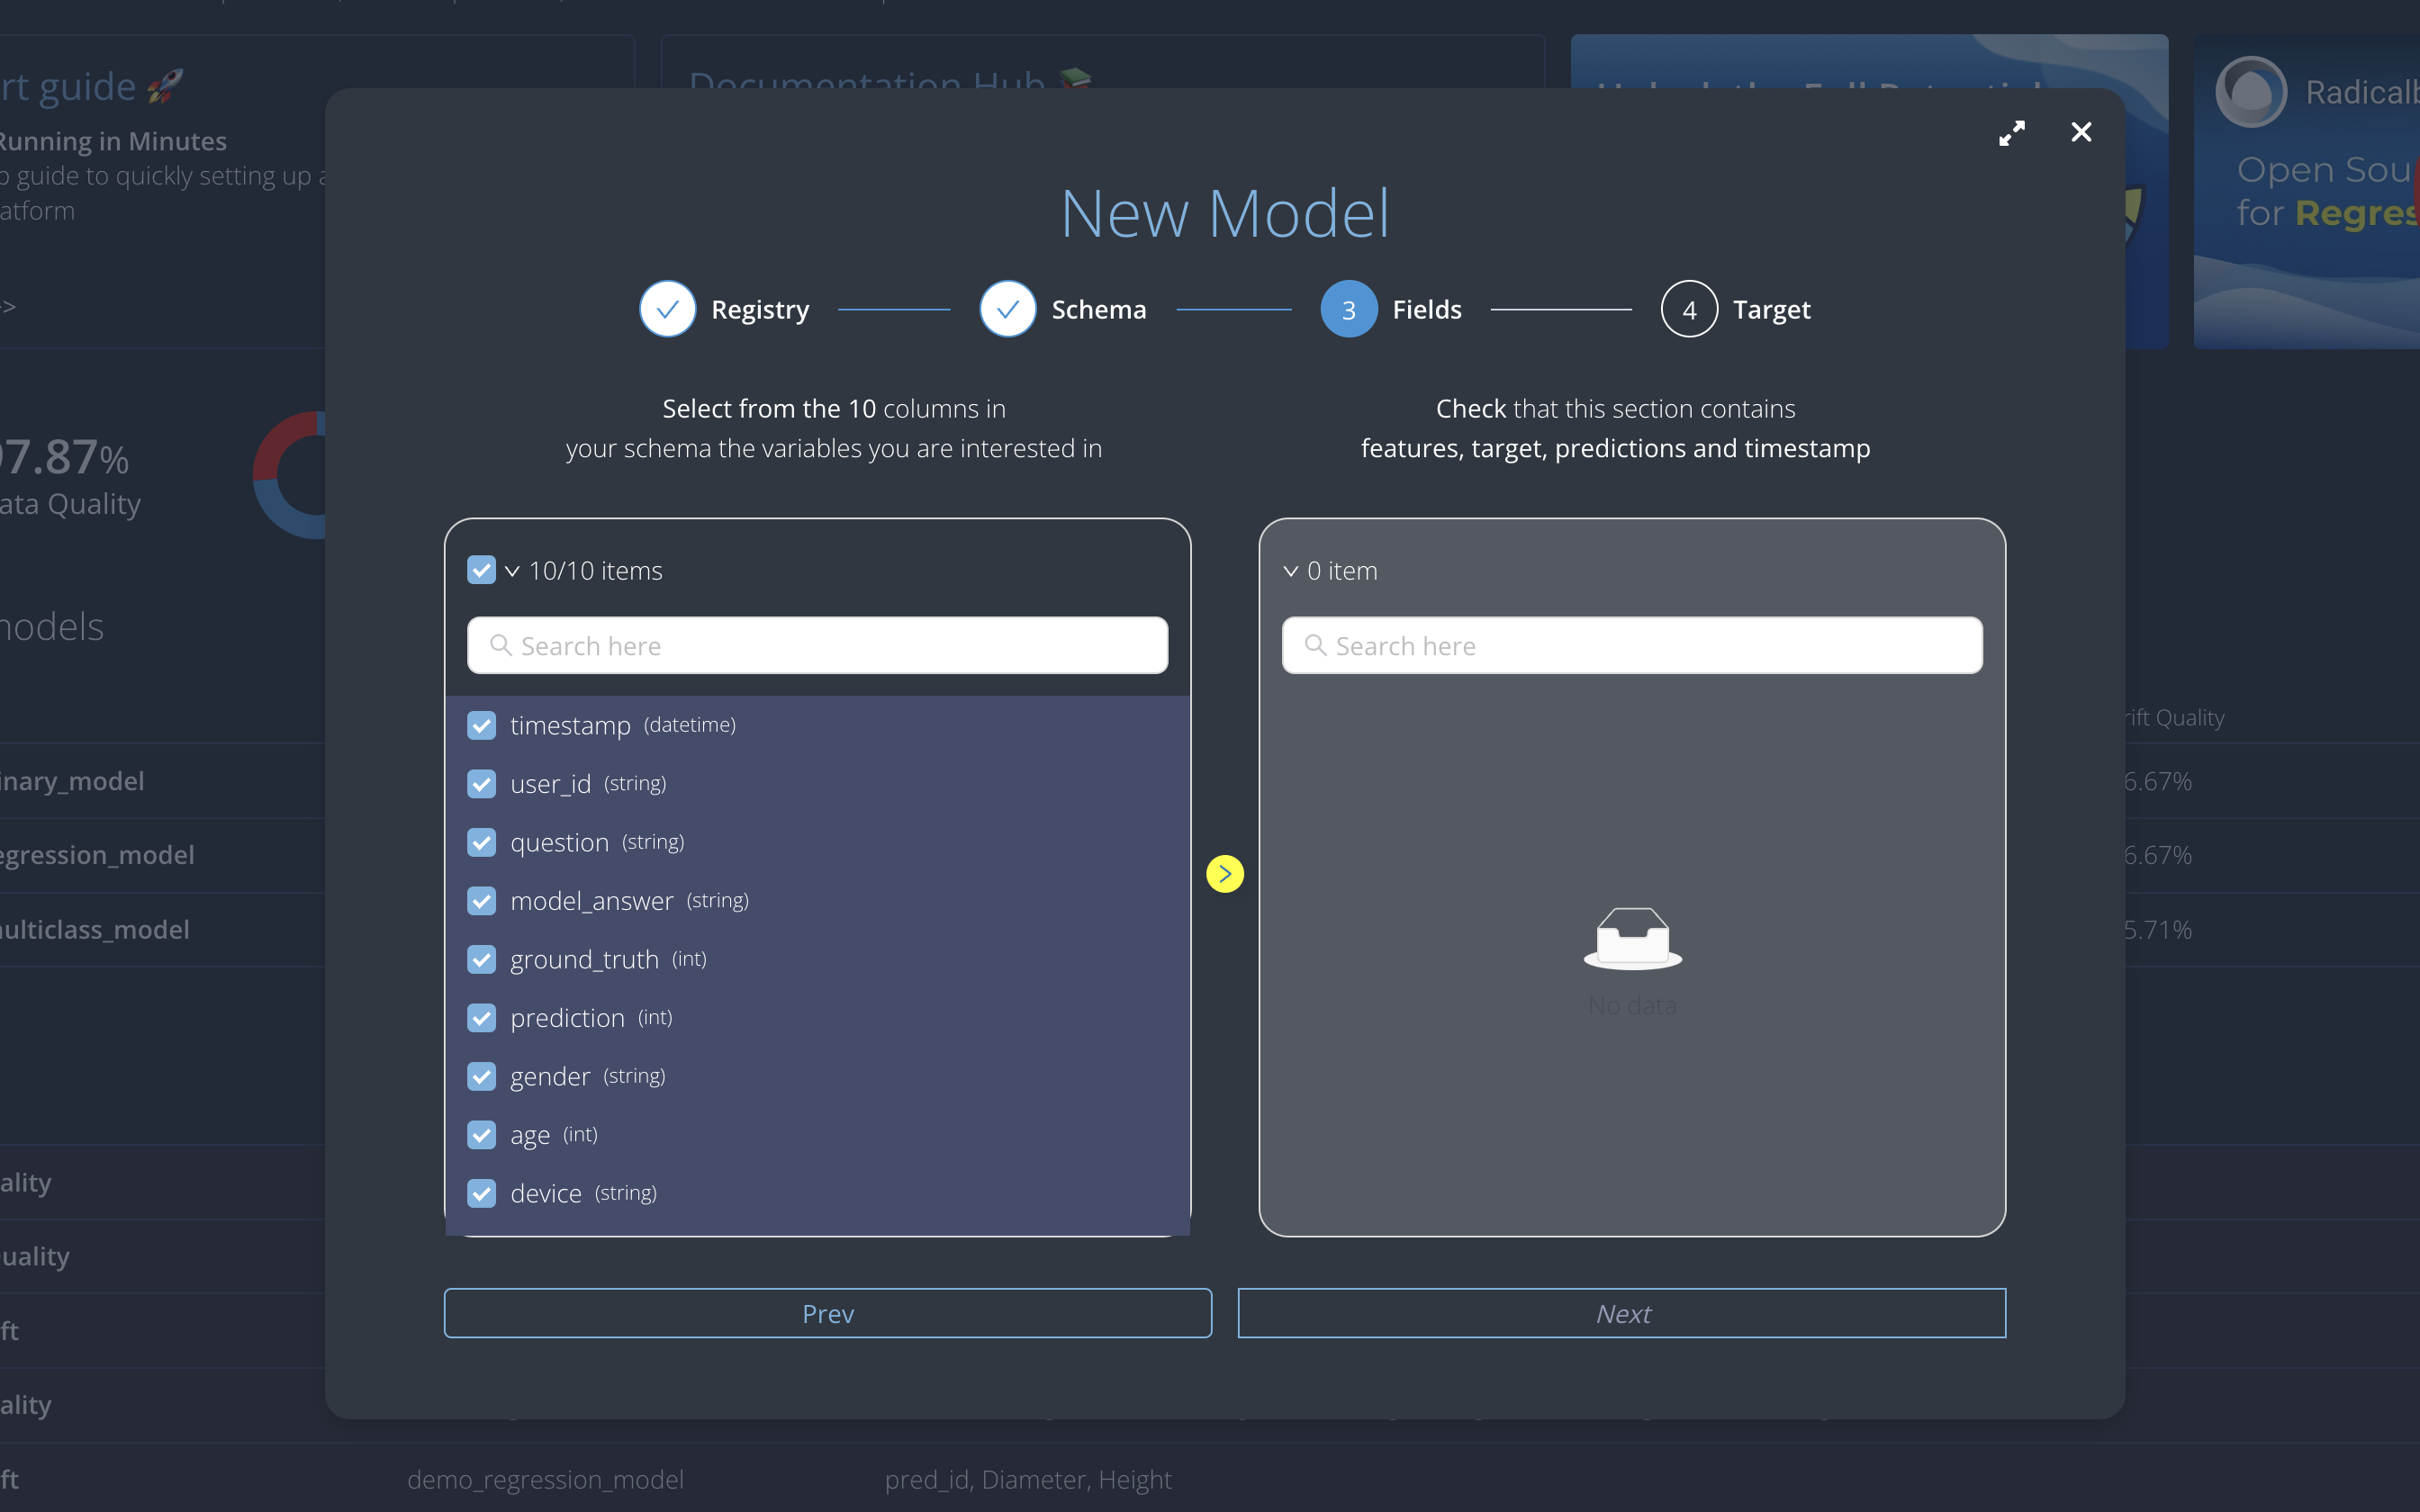
Once you have defined the model schema, select the output fields from the variables. Choose model_answer and prediction, move them to the right, and click on the Next button.
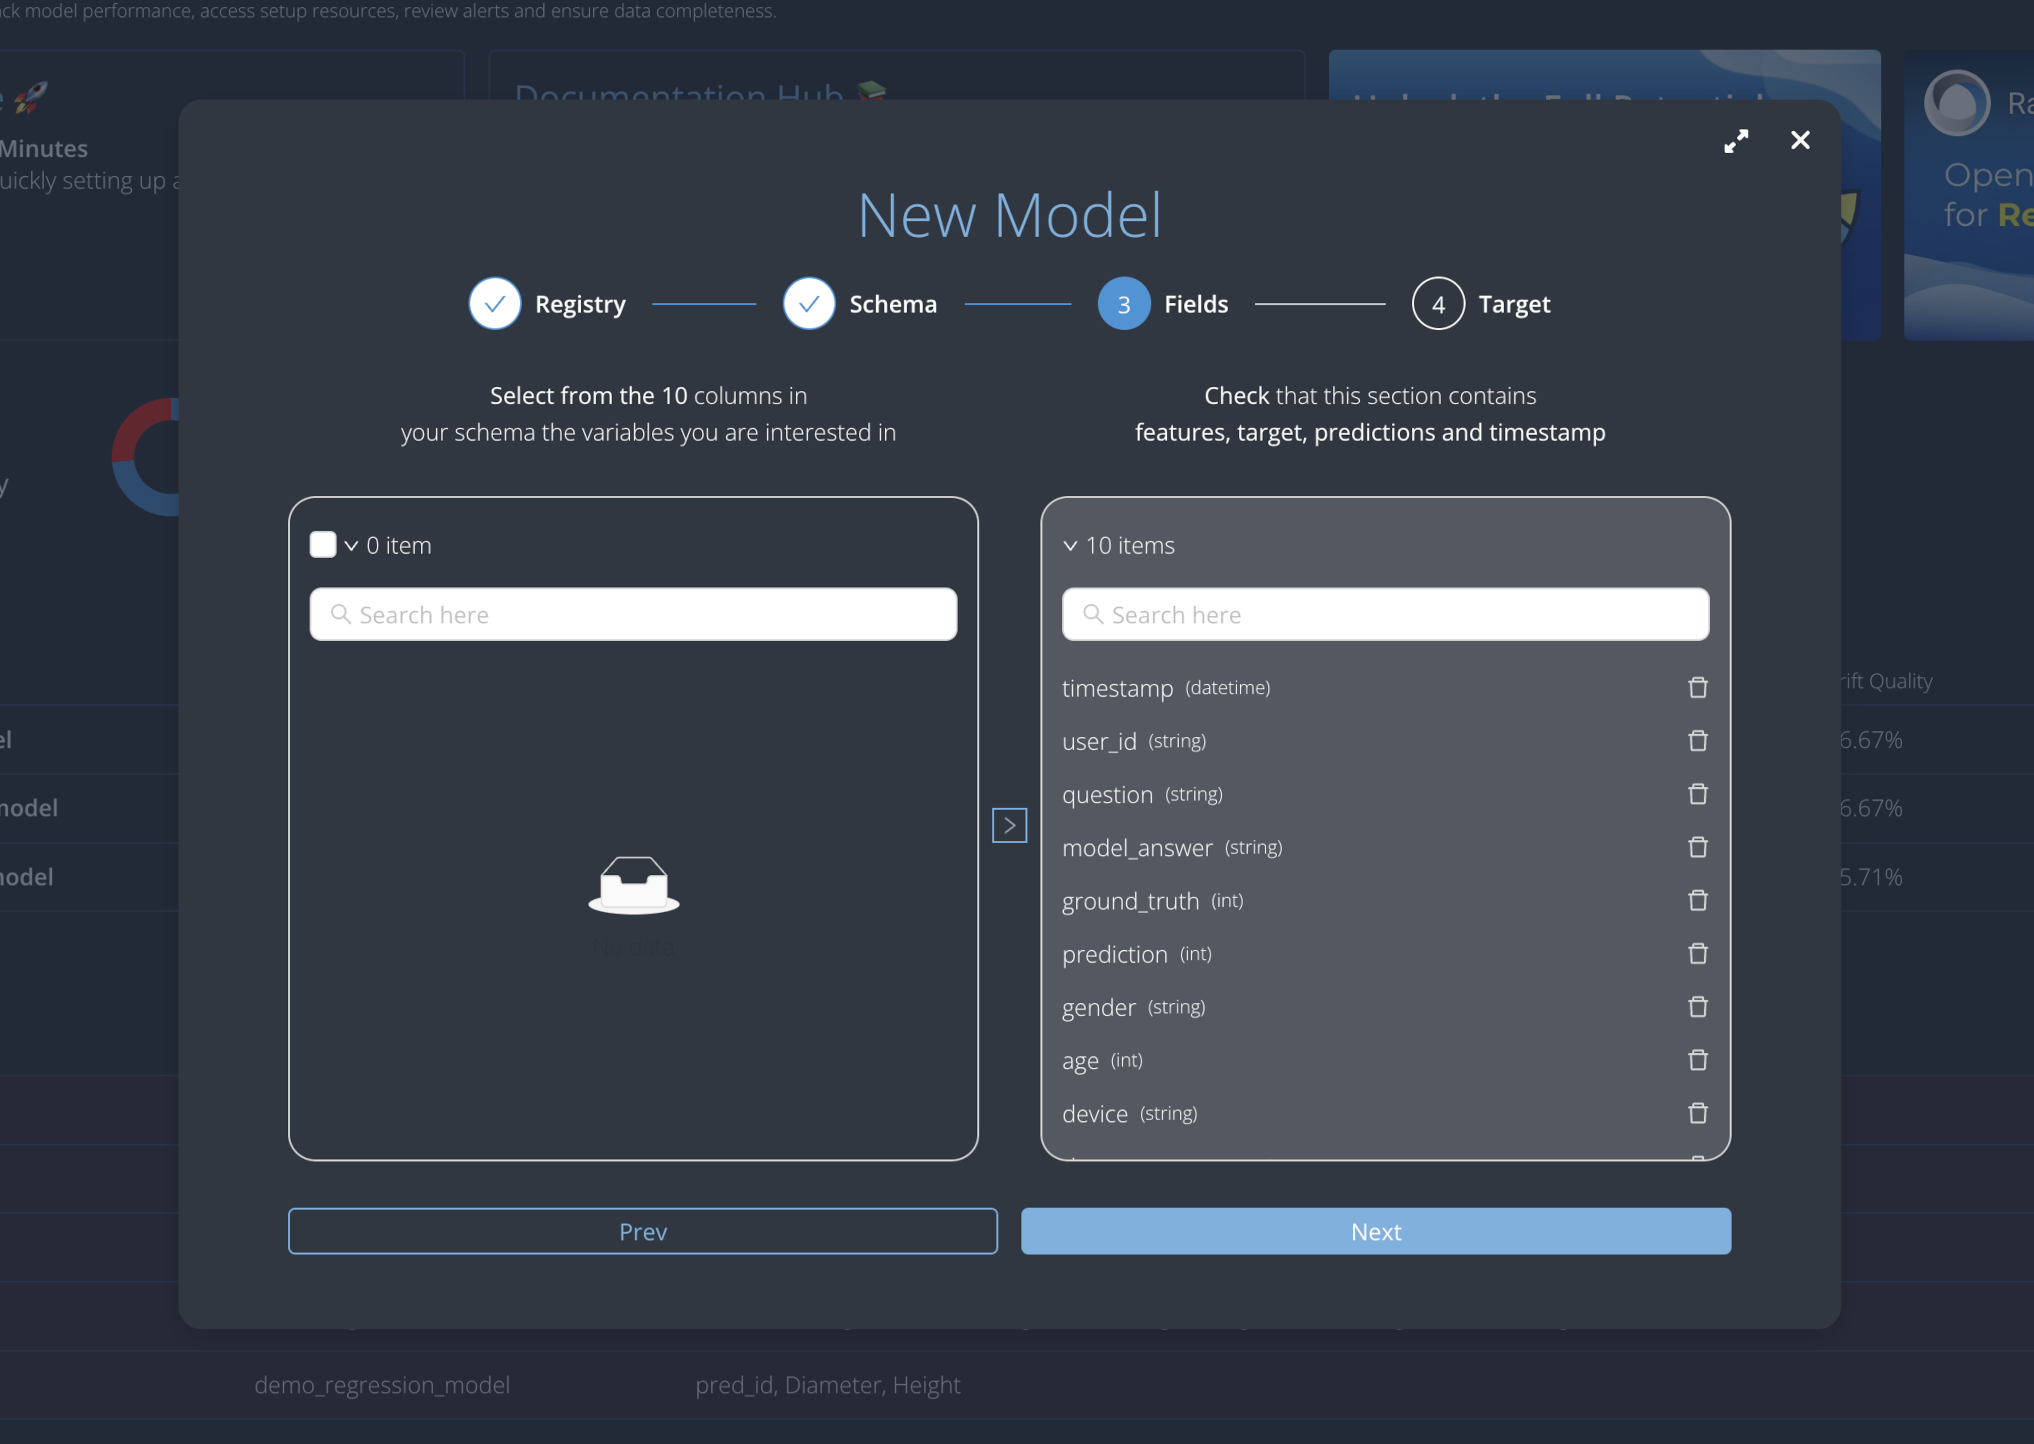
Finally, you need to select and associate the following fields:
- Target: the target field or ground truth;
- Timestamp: the field containing the timestamp value;
- Prediction: the actual prediction;
- Probability: the probability score associated with the prediction.
Match the following values to their corresponding fields:
- Target:
ground_truth; - Timestamp:
timestamp; - Prediction:
prediction; - Probability: leave it empty;
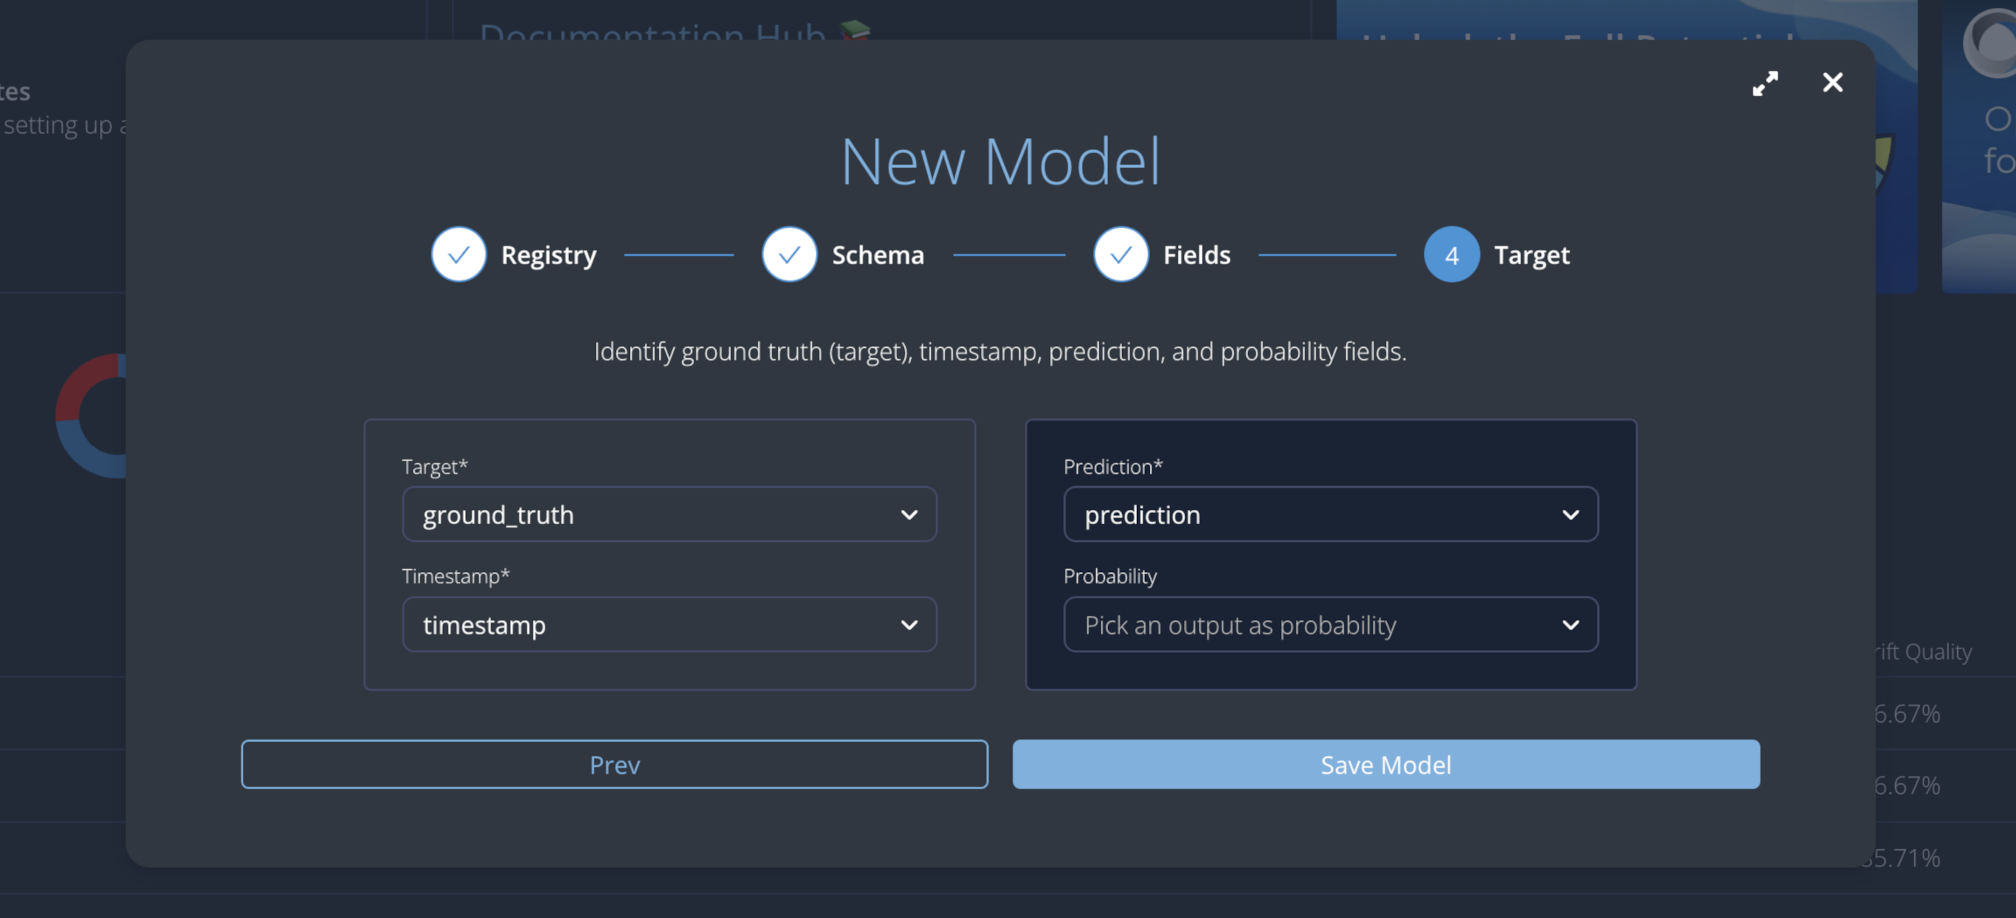
Click the Save Model button to finalize model creation.
Model details
Entering into the model details, we can see three different main sections:
- Overview: this section provides information about the dataset and its schema. You can view a summary, and explore the variables (features and ground truth) and the output fields for your model.
- Reference: the Reference section displays performance metrics calculated on the imported reference data.
- Current: the Current section displays metrics for any user-uploaded data sets you have added in addition to the reference dataset.
Import Reference Dataset
To calculate metrics for your reference dataset, import this CSV file, containing the reference.
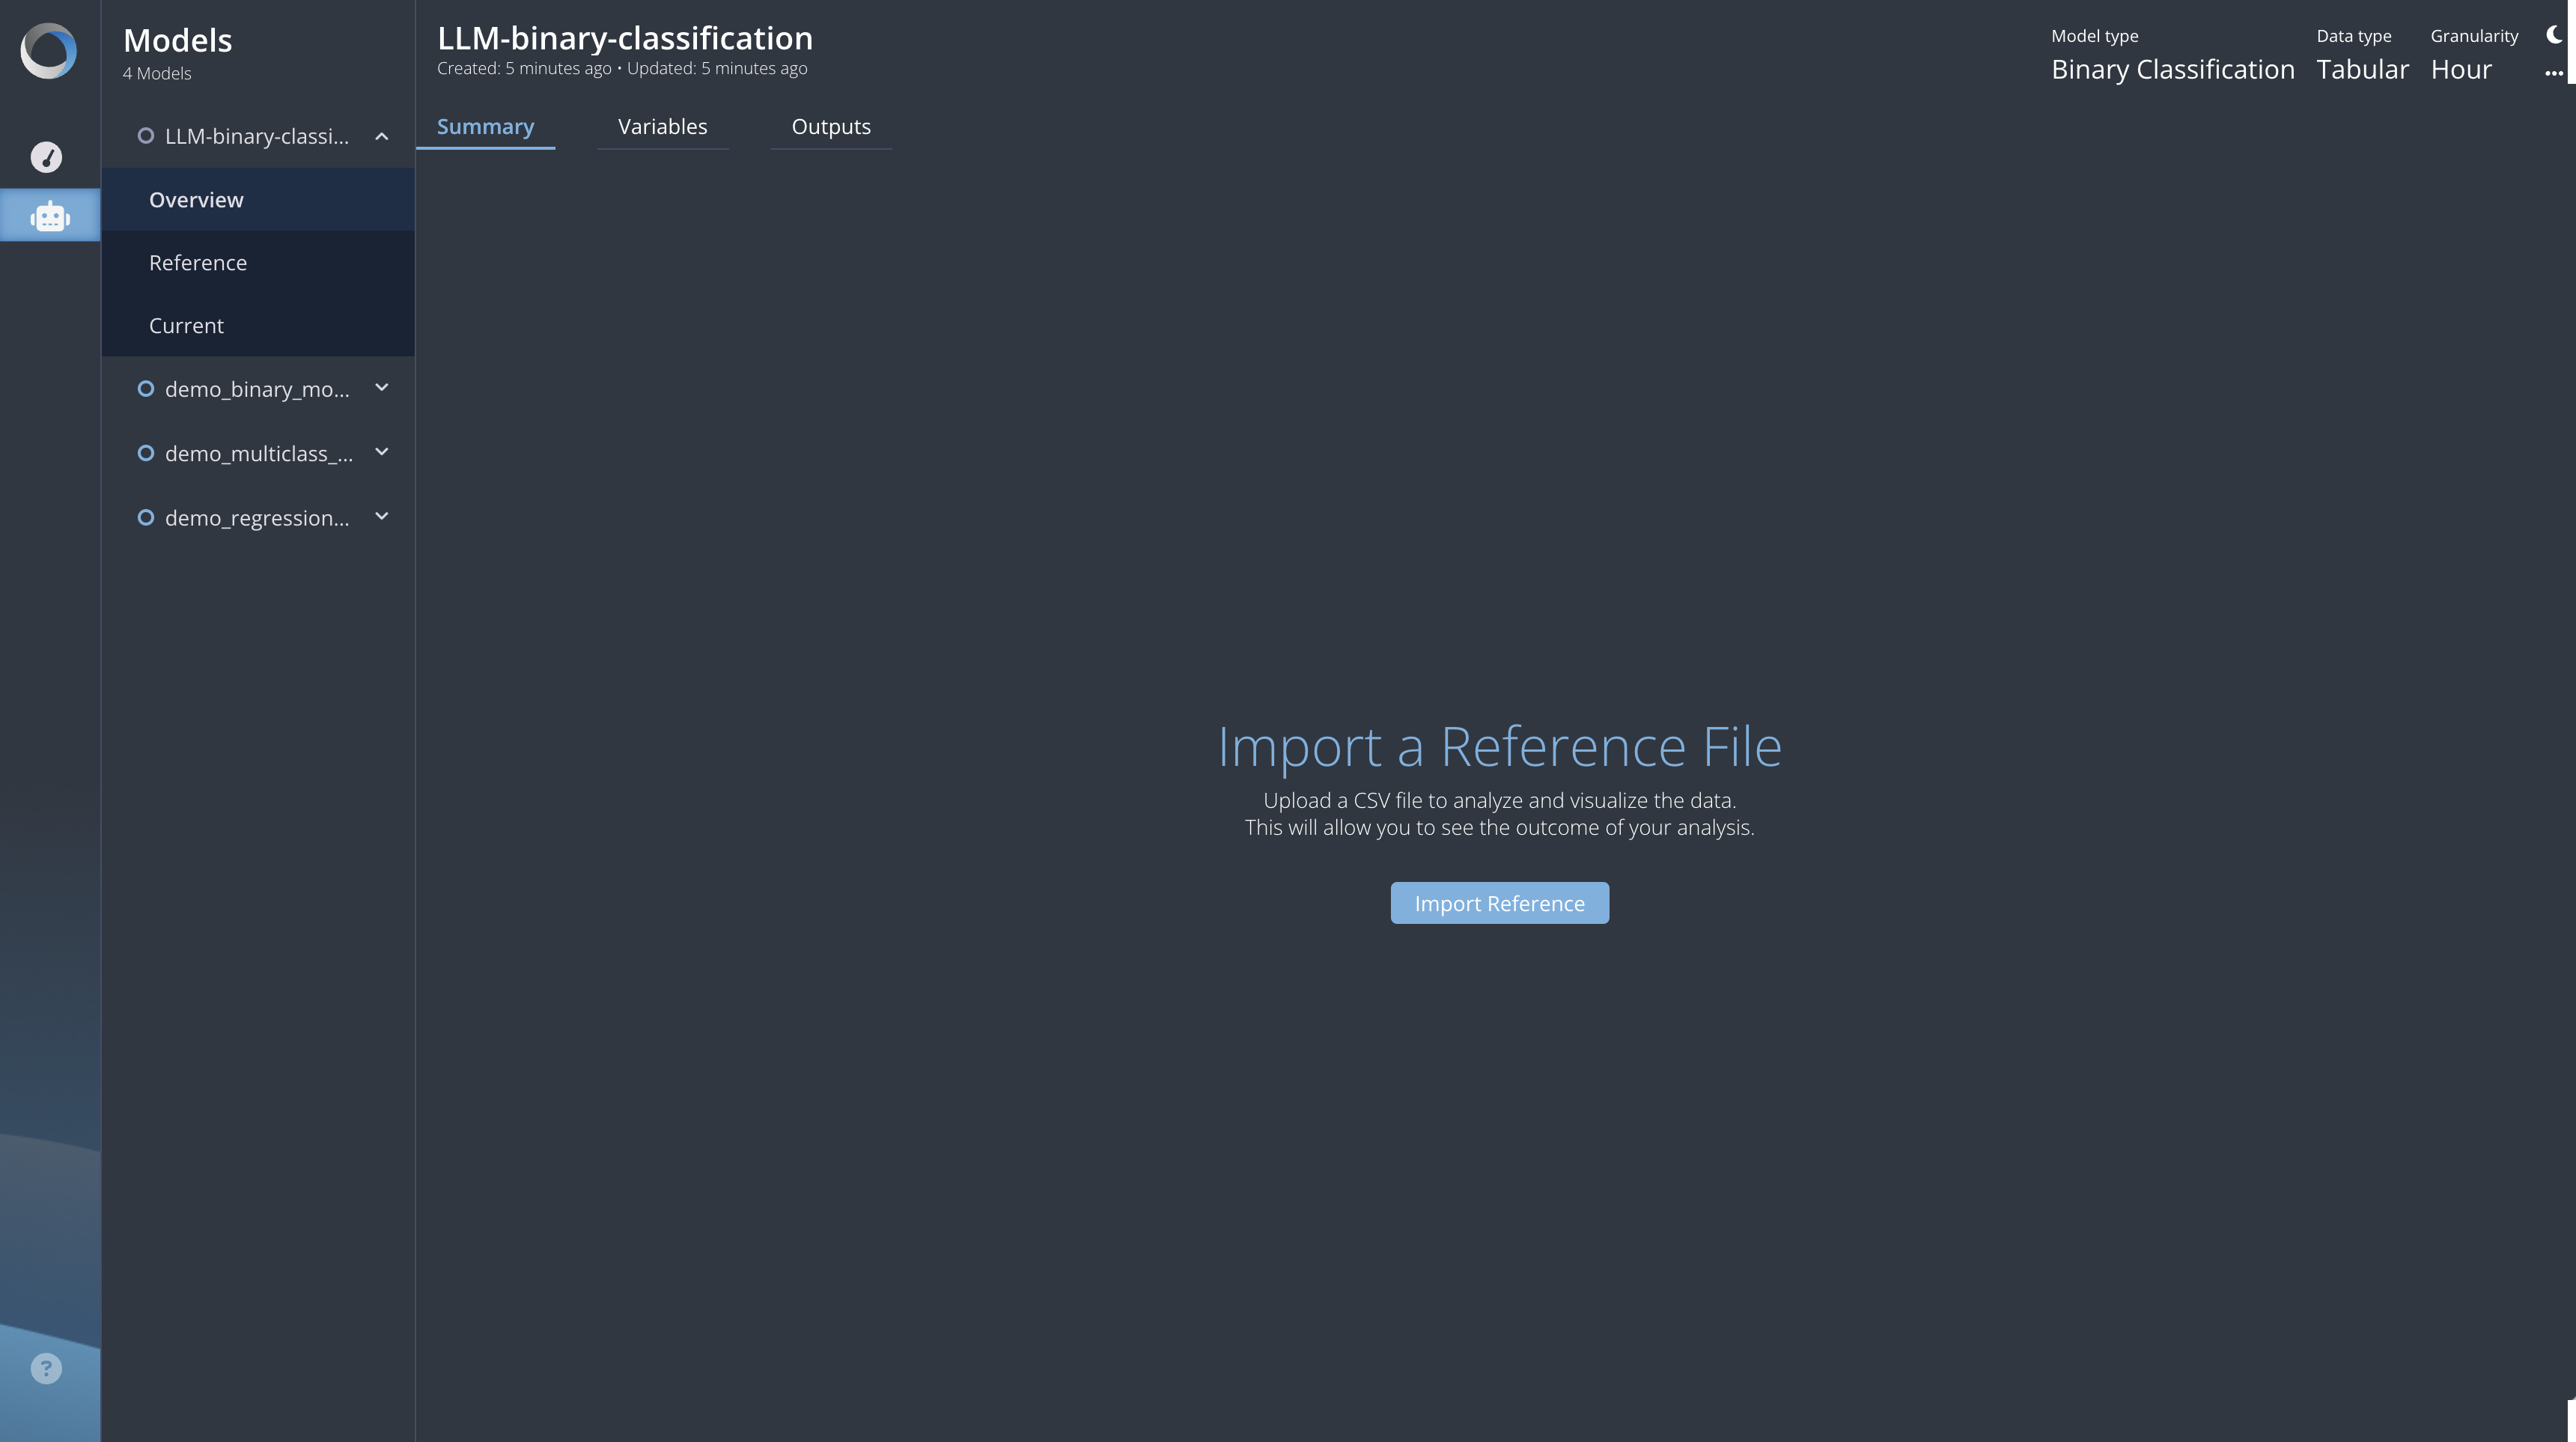
Once you initiate the process, the platform will run background jobs to calculate the metrics.
After processing, you will be able to see the following information:
- in the Overview section a column names and types summary will appear.
- in the Reference section a statistical summary of your data will be computed.
Within the Reference section, you can browse between 3 different tabs:
- Data Quality: This tab contains statistical information and charts of your reference dataset, including the number of rows and your data distribution through bar plots (for categorical fields) and histograms (for numerical fields). Additionally, to make comparisons and analysis easier, you can choose the order in which to arrange your charts.
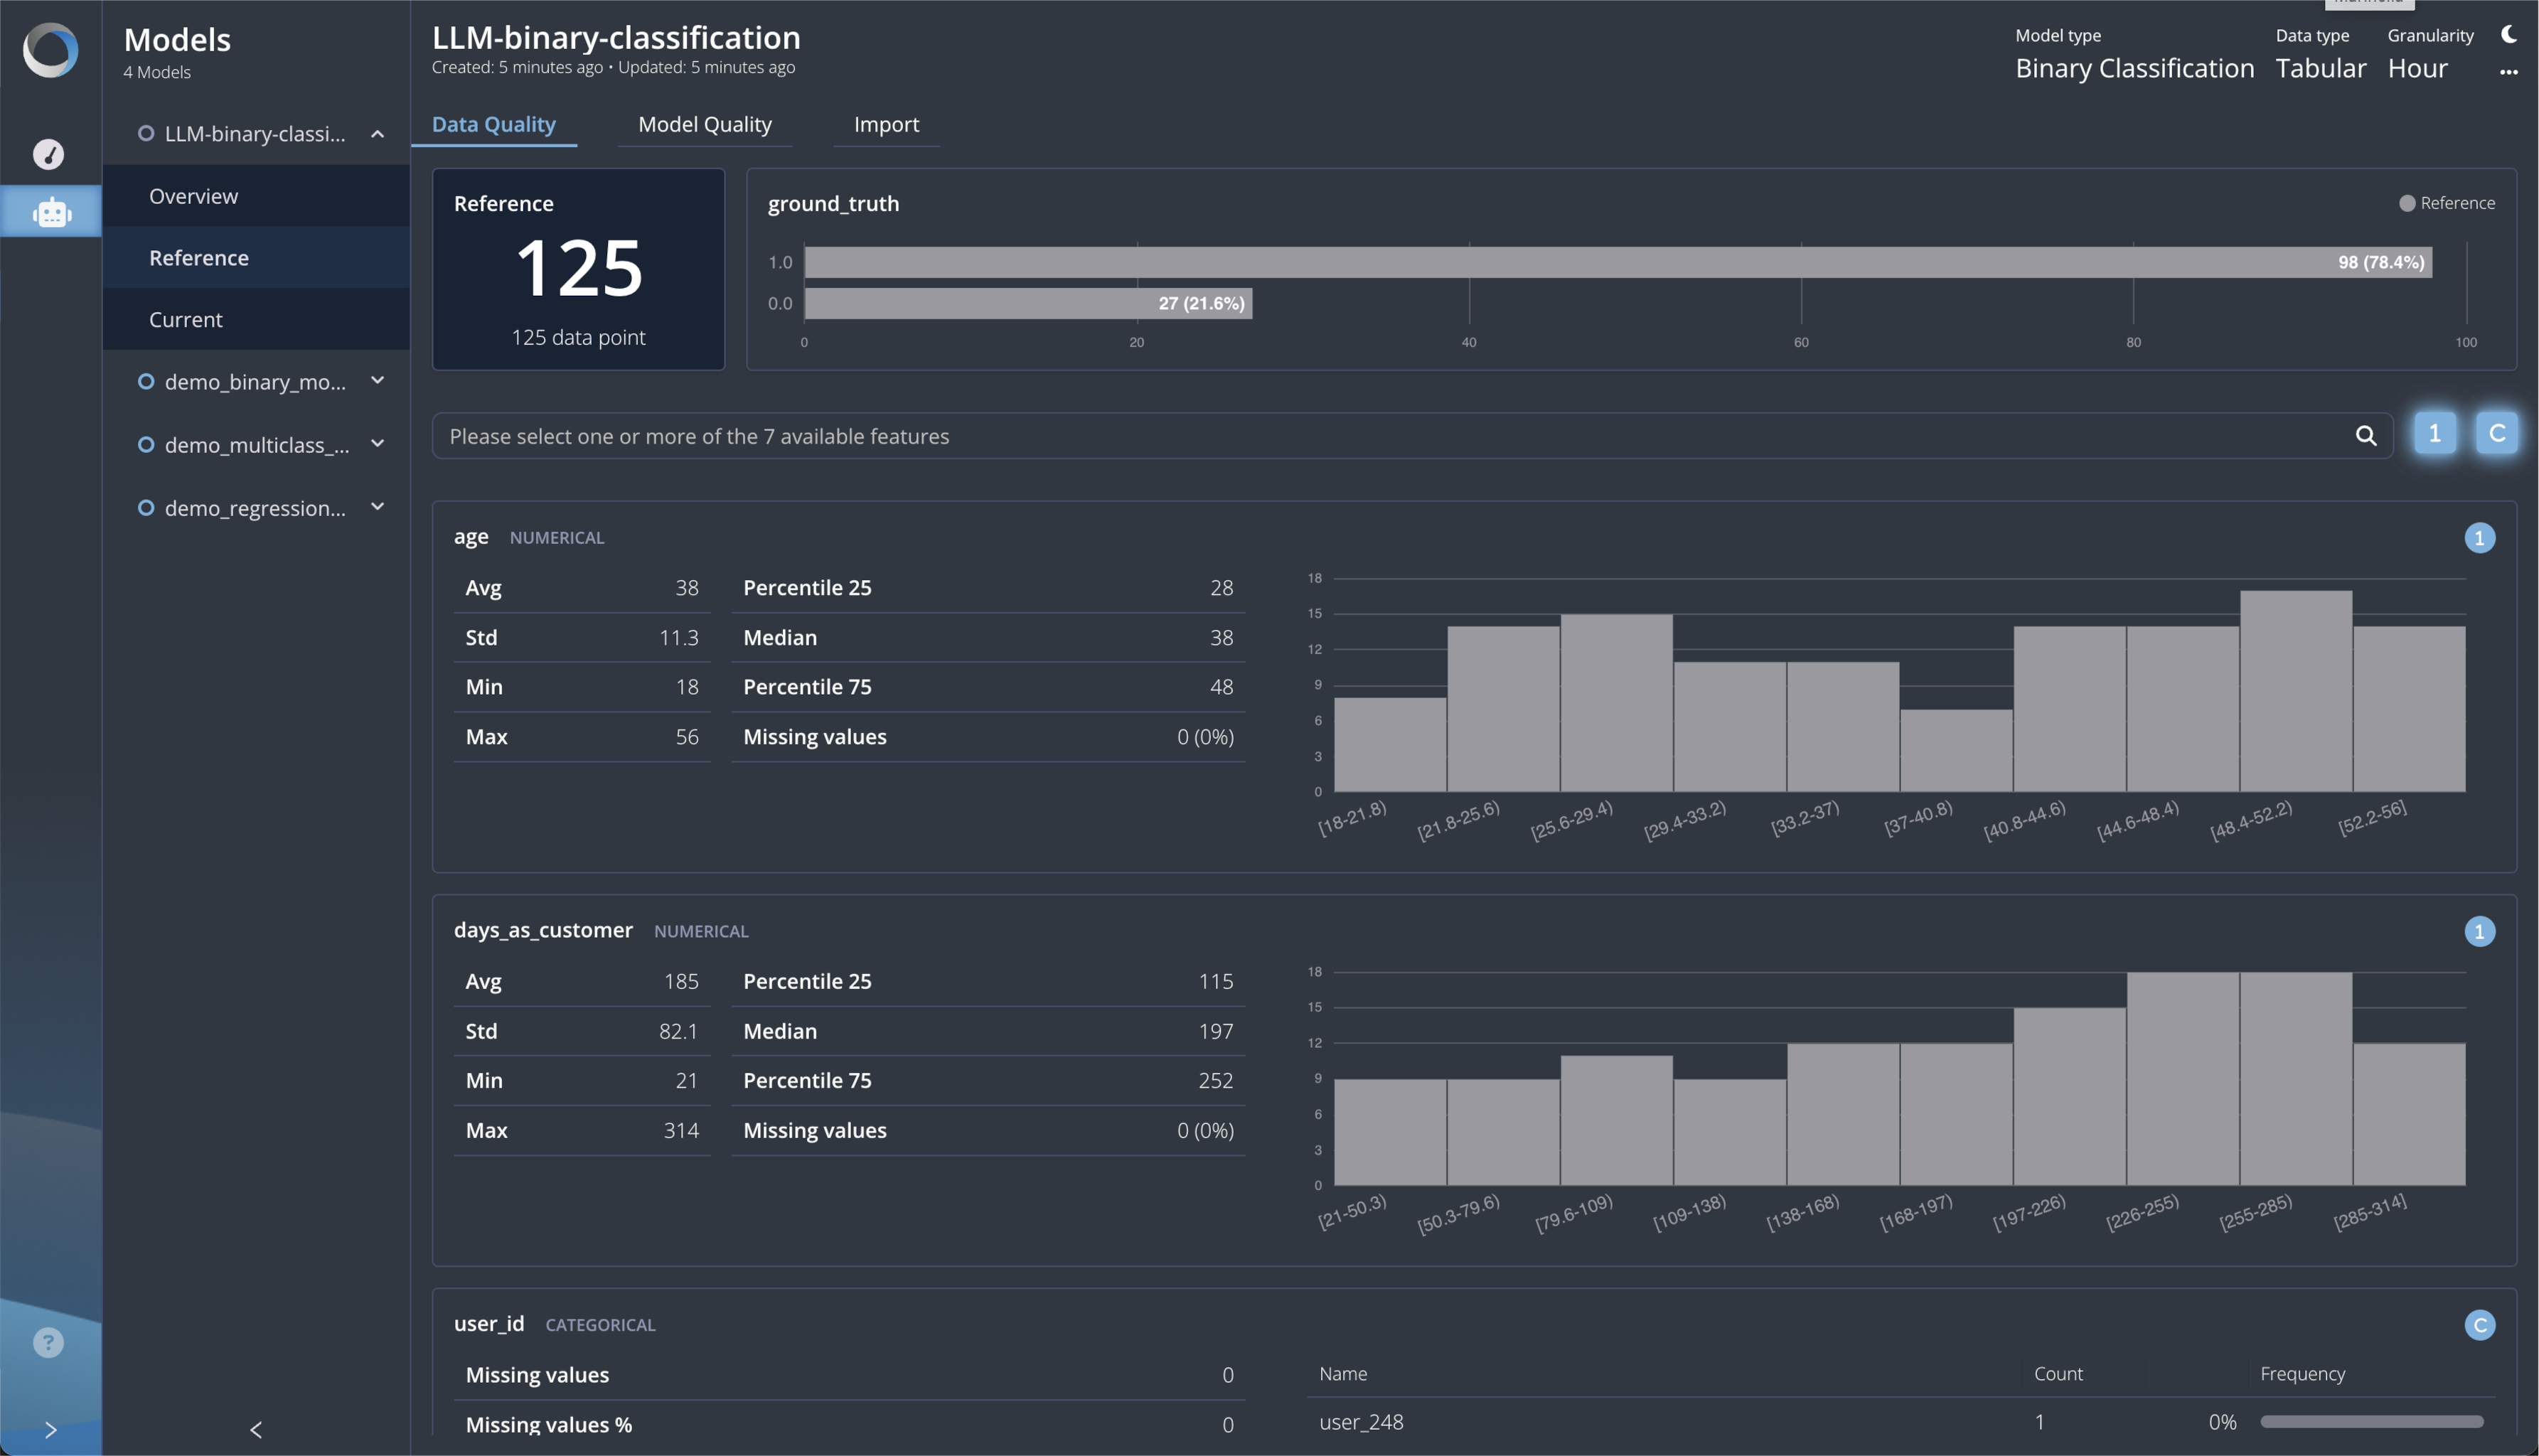
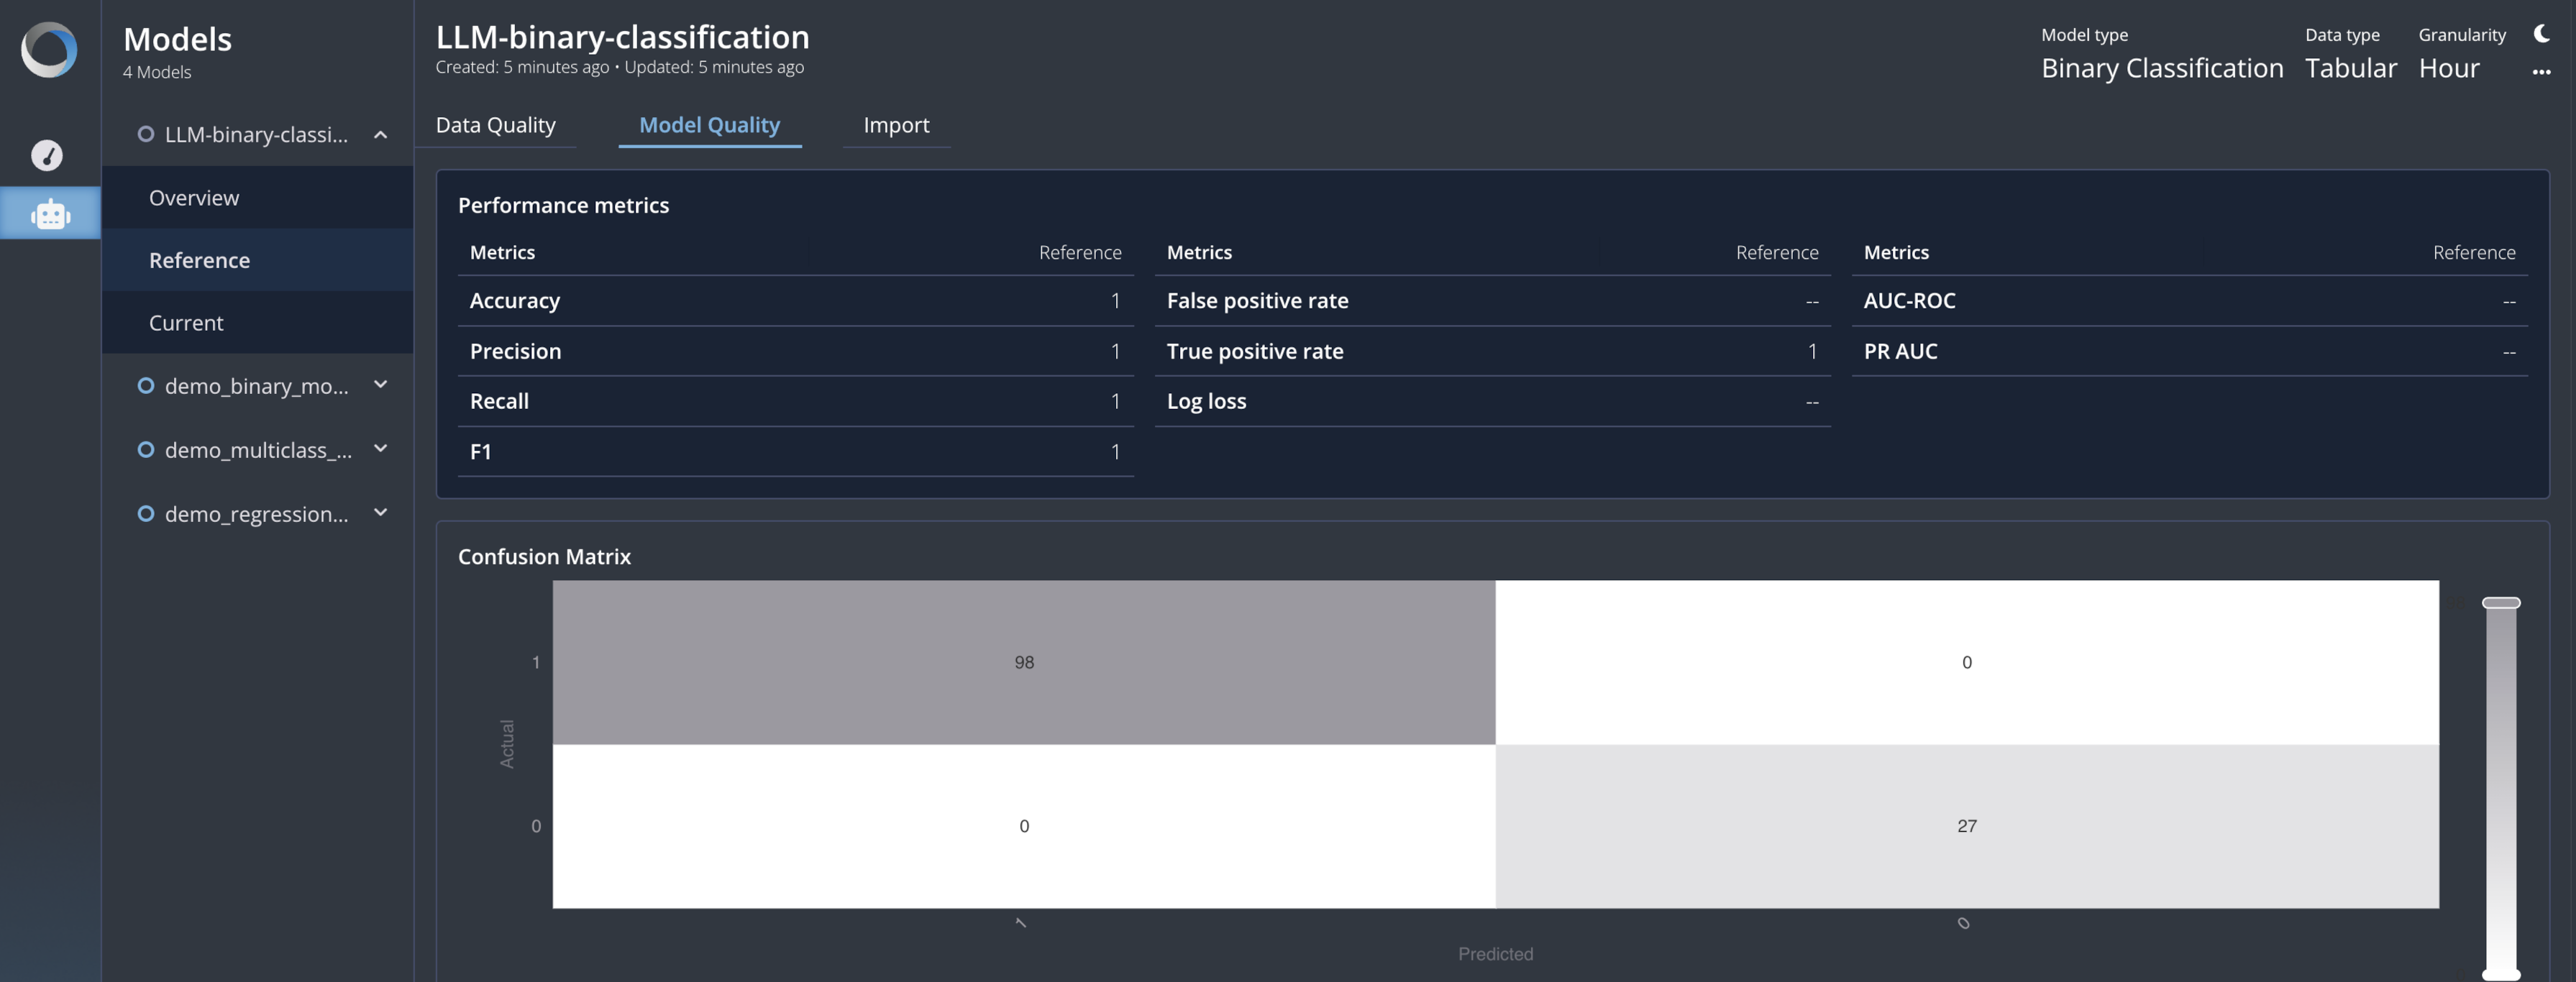
- Model Quality: This tab provides detailed information about model performance, which we can compute since you provide both predictions and ground truths. These metrics (in this tutorial related to a binary classification task) are computed by aggregating the whole reference dataset, offering an overall expression of your model quality for this specific reference.
- Import: This tab displays all the useful information about the storage of the reference dataset.

Import Current Dataset
Once your reference data has been imported and all the metrics and information about it are available, you can move to the Current section, in which you can import the CSV file containing your current dataset.
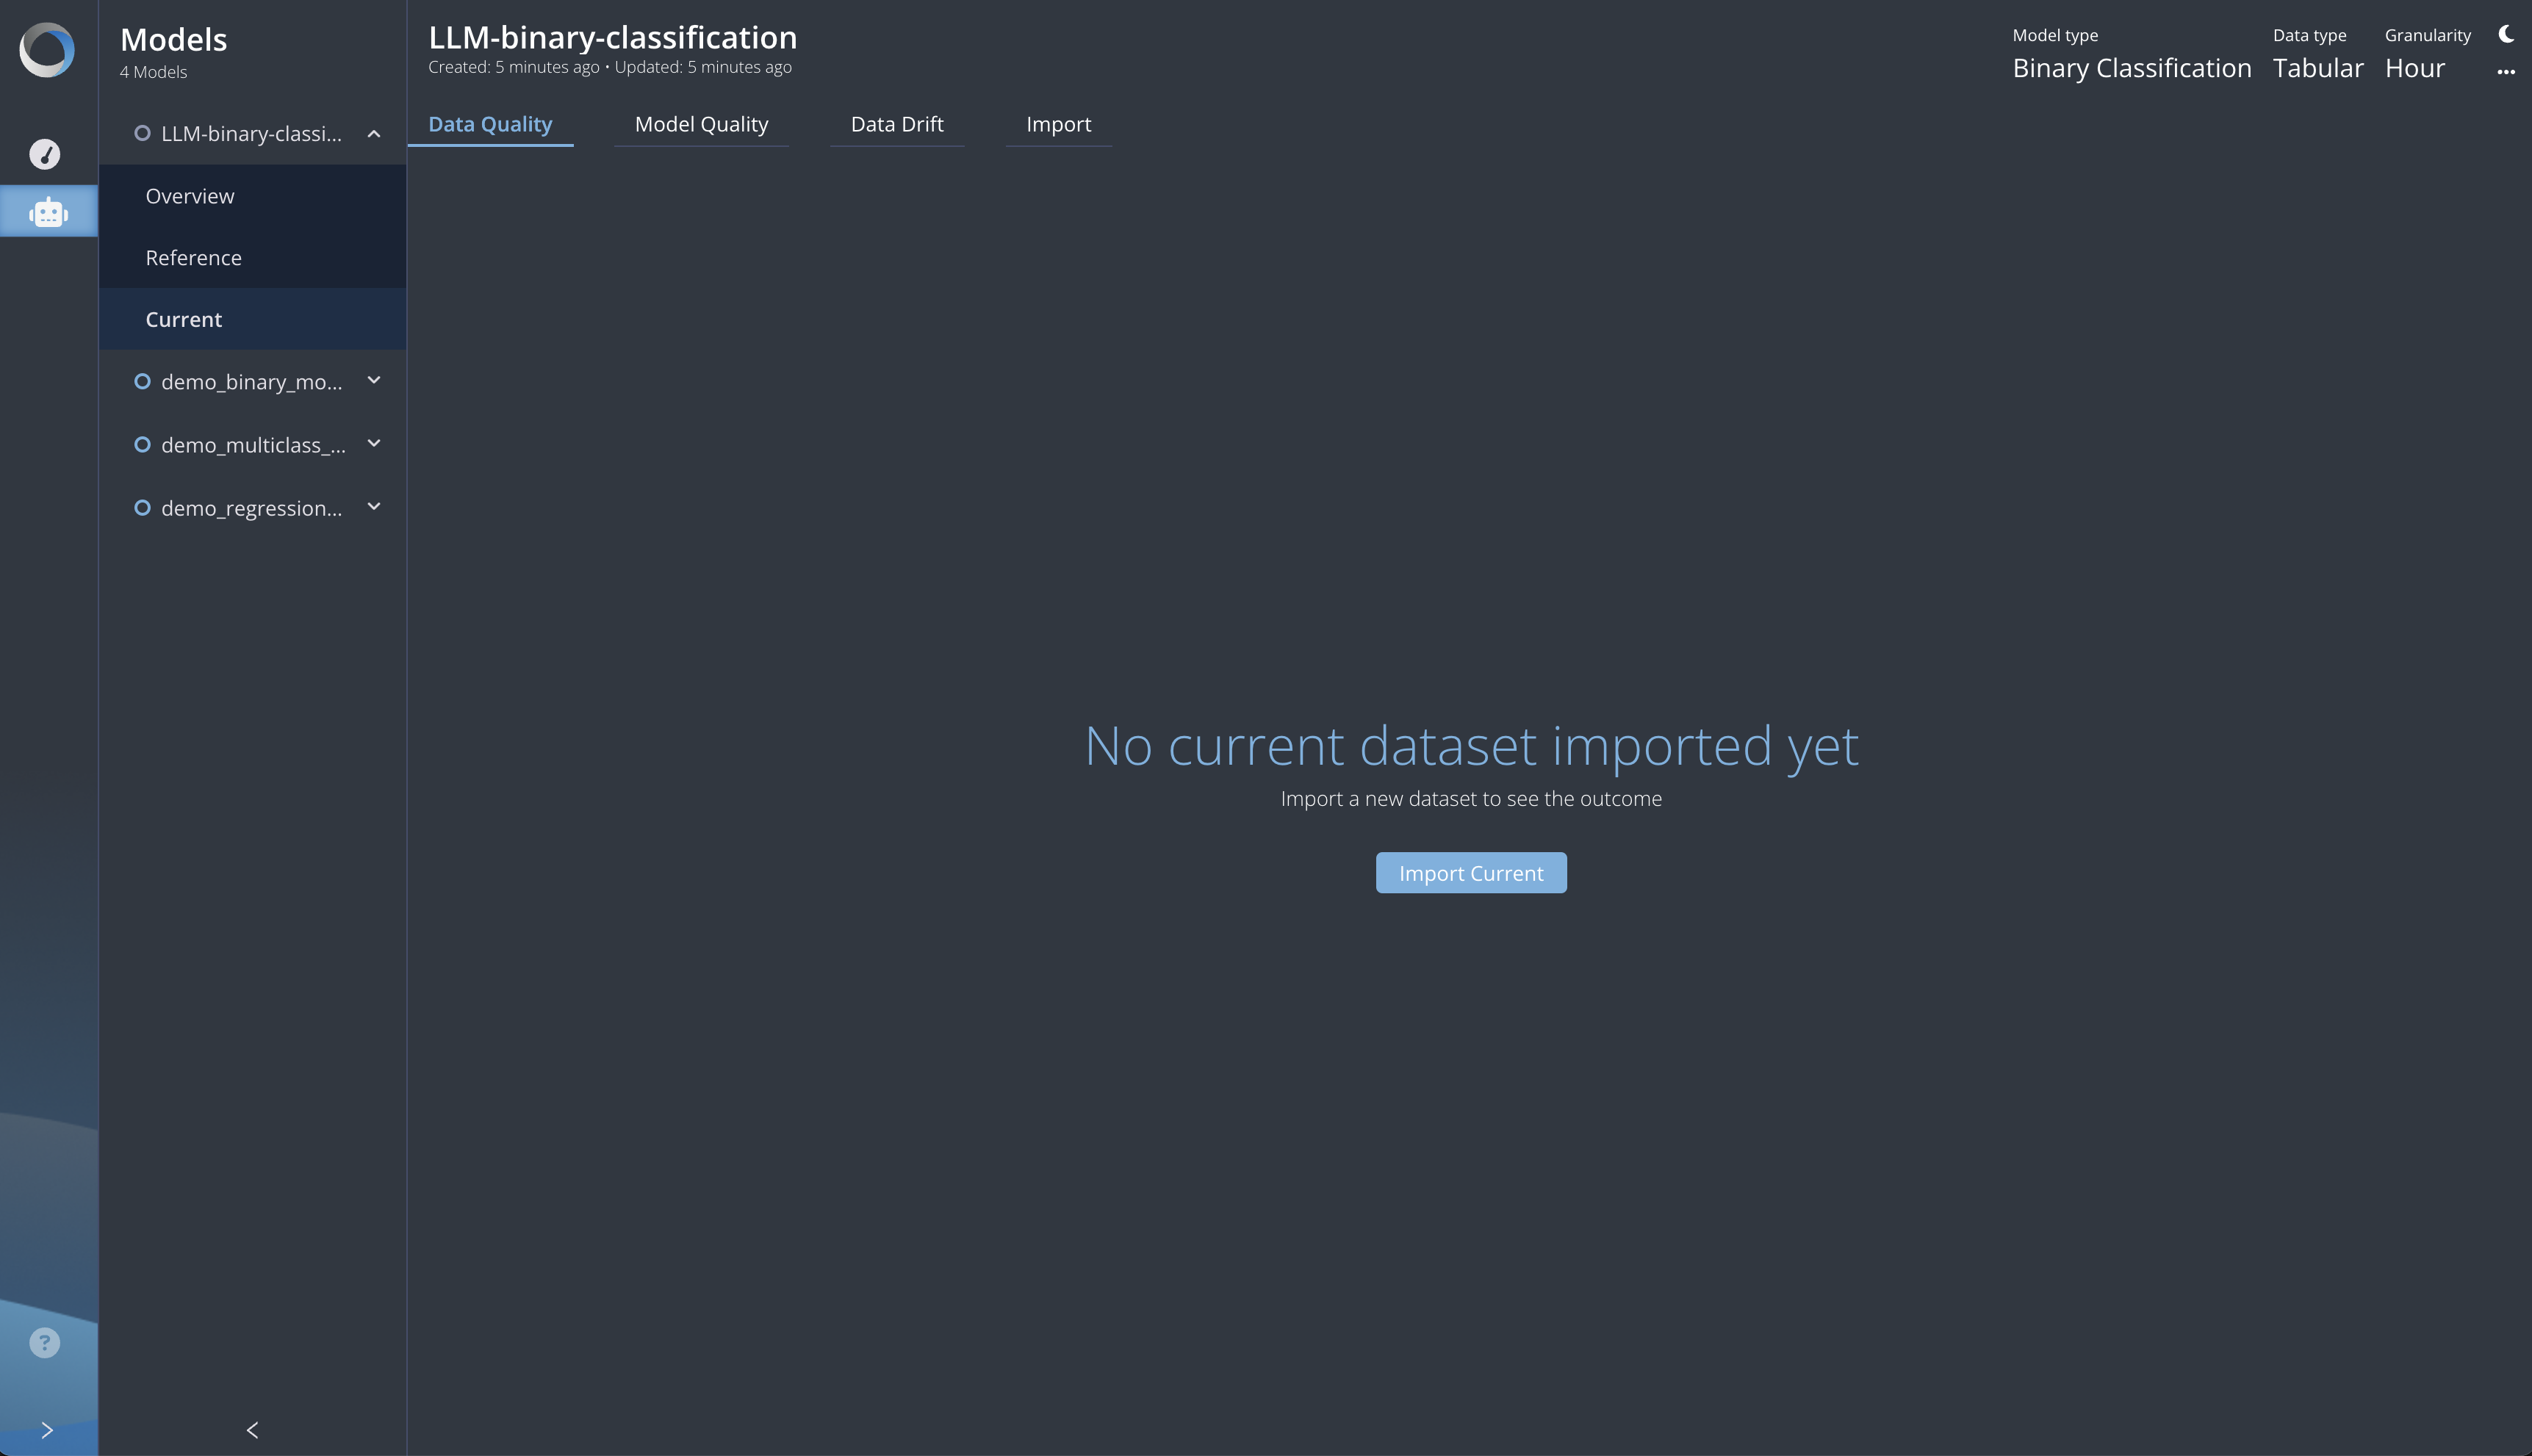
This action will unlock all the tools you need to compare metrics between the reference and current files.
In detail, you can browse between 4 tabs:
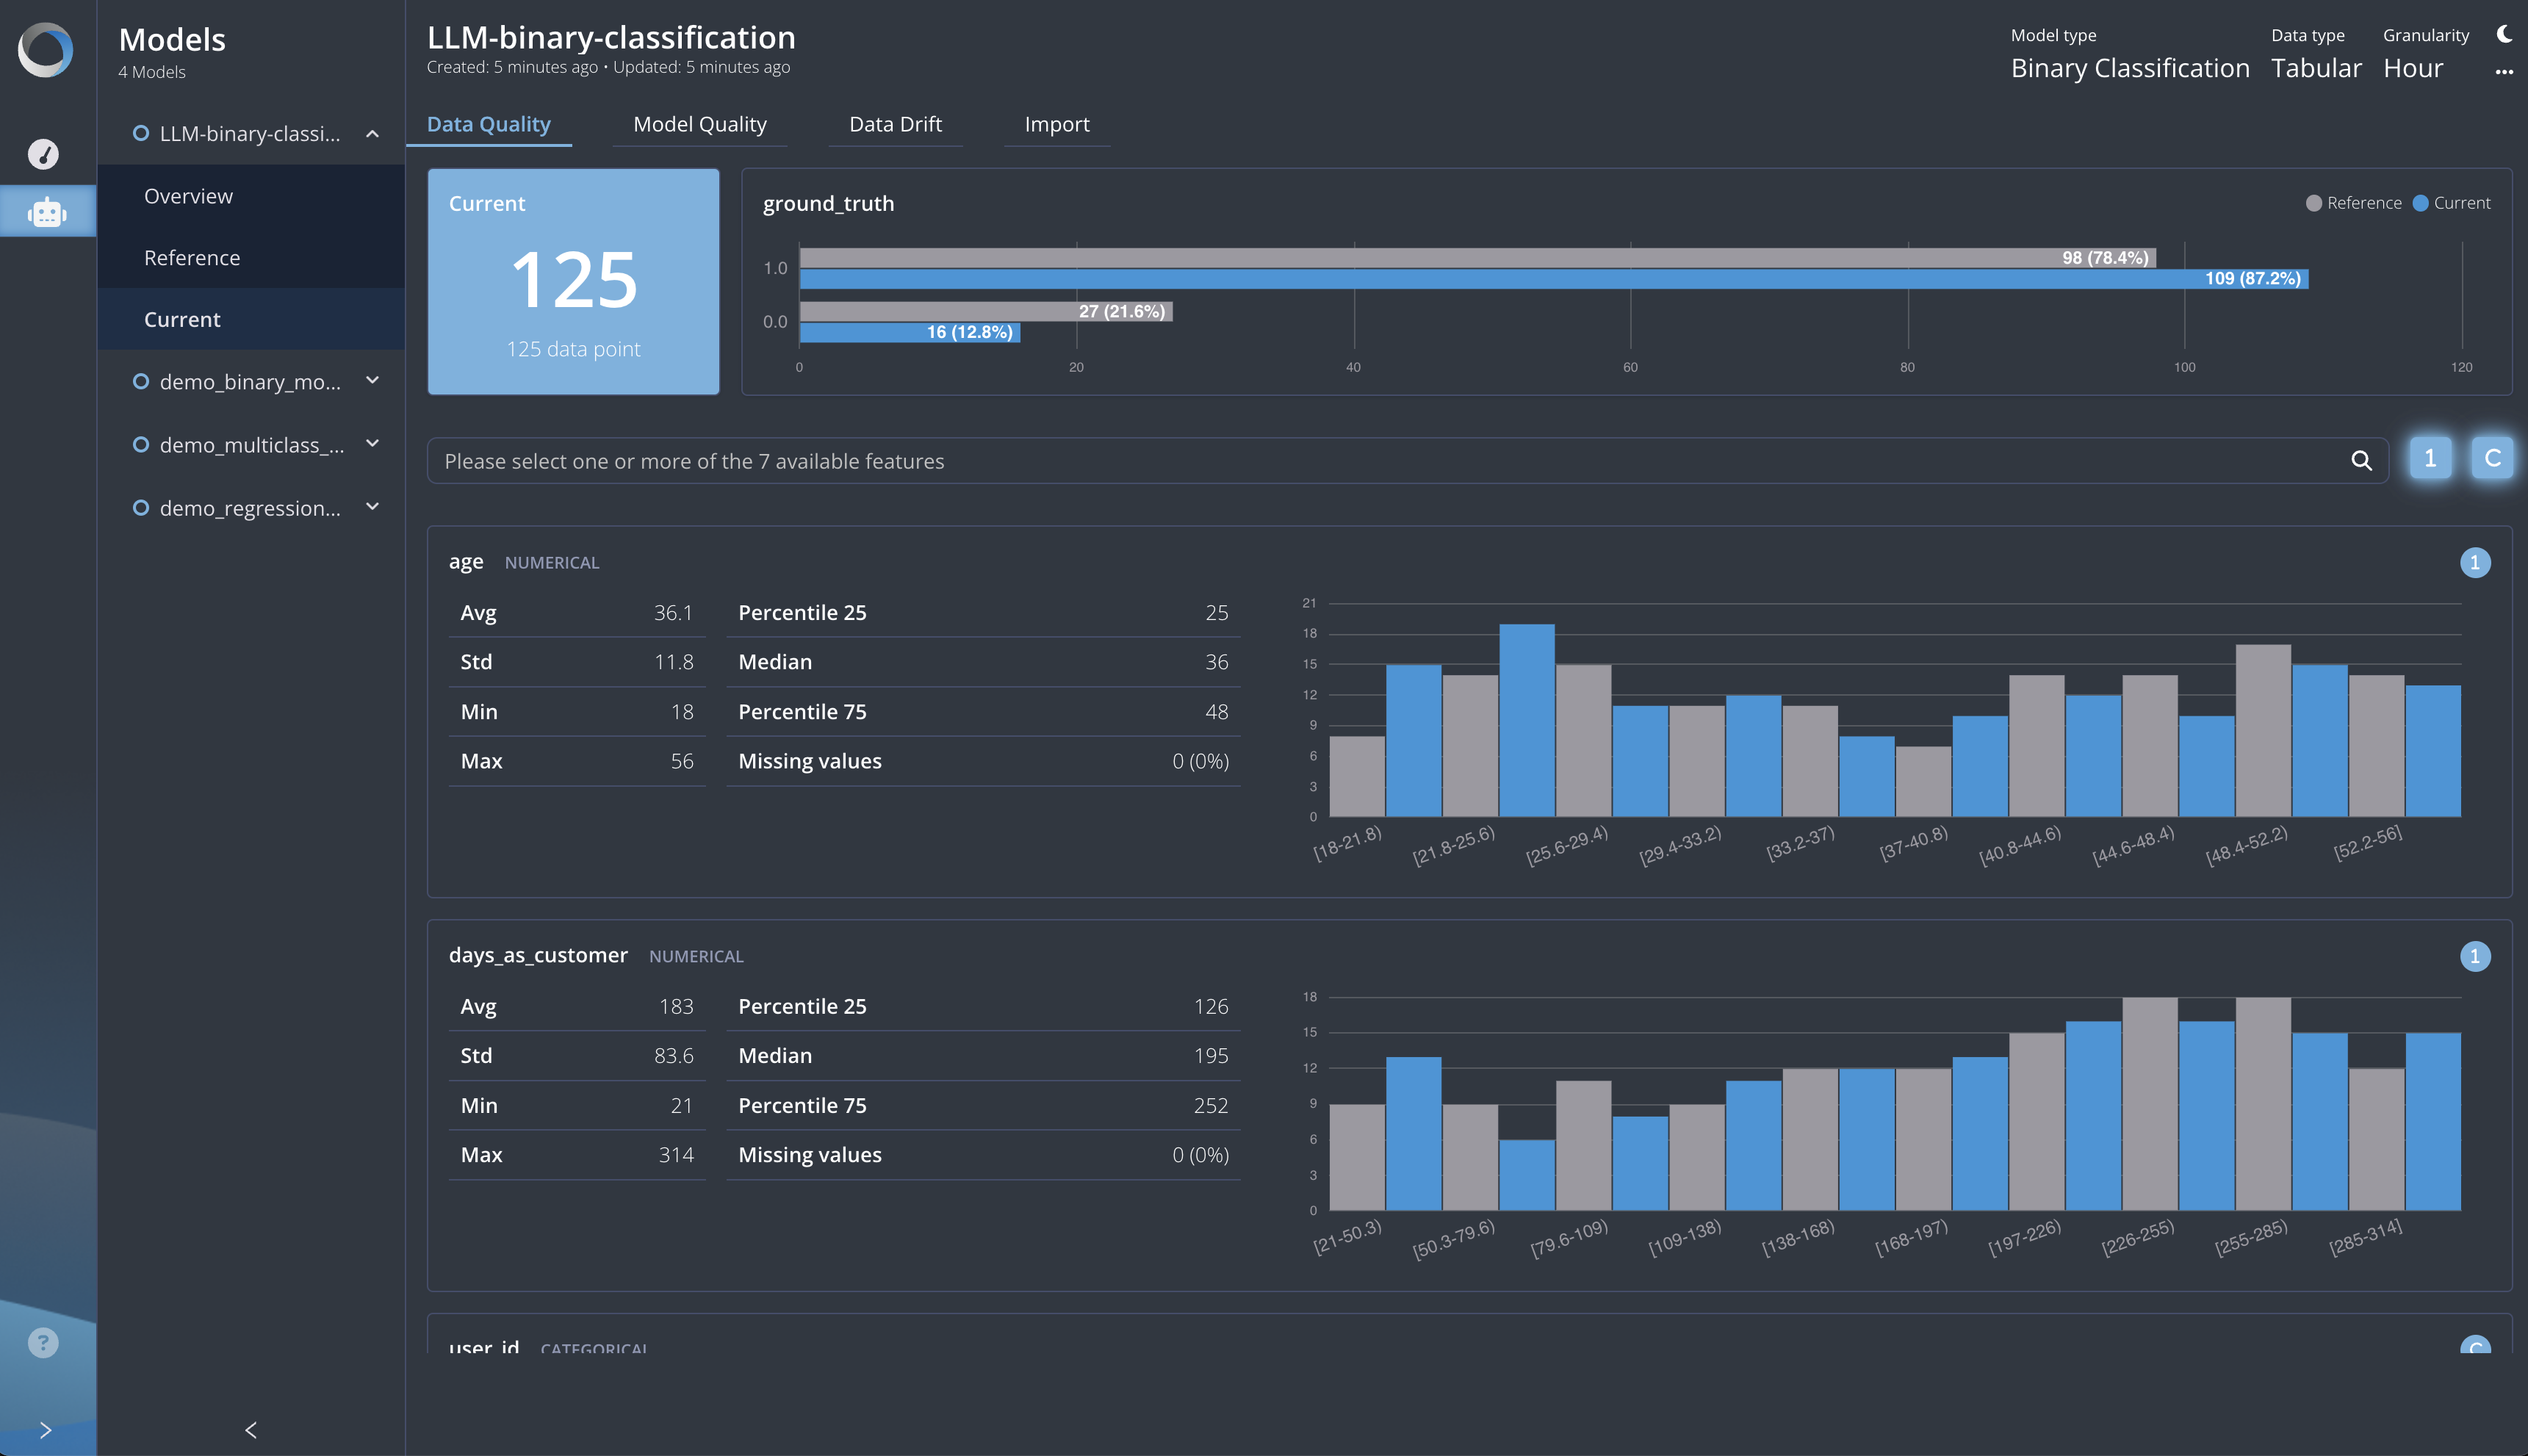
- Data Quality: Here, the same metrics you have in the Reference section will also be computed for the current dataset. All the information will be presented side by side so that you can compare and analyze any differences. Throughout the platform, the blue color stands for the current dataset while the gray stands for the reference dataset, allowing you to easily identify which dataset a specific metric belongs to.
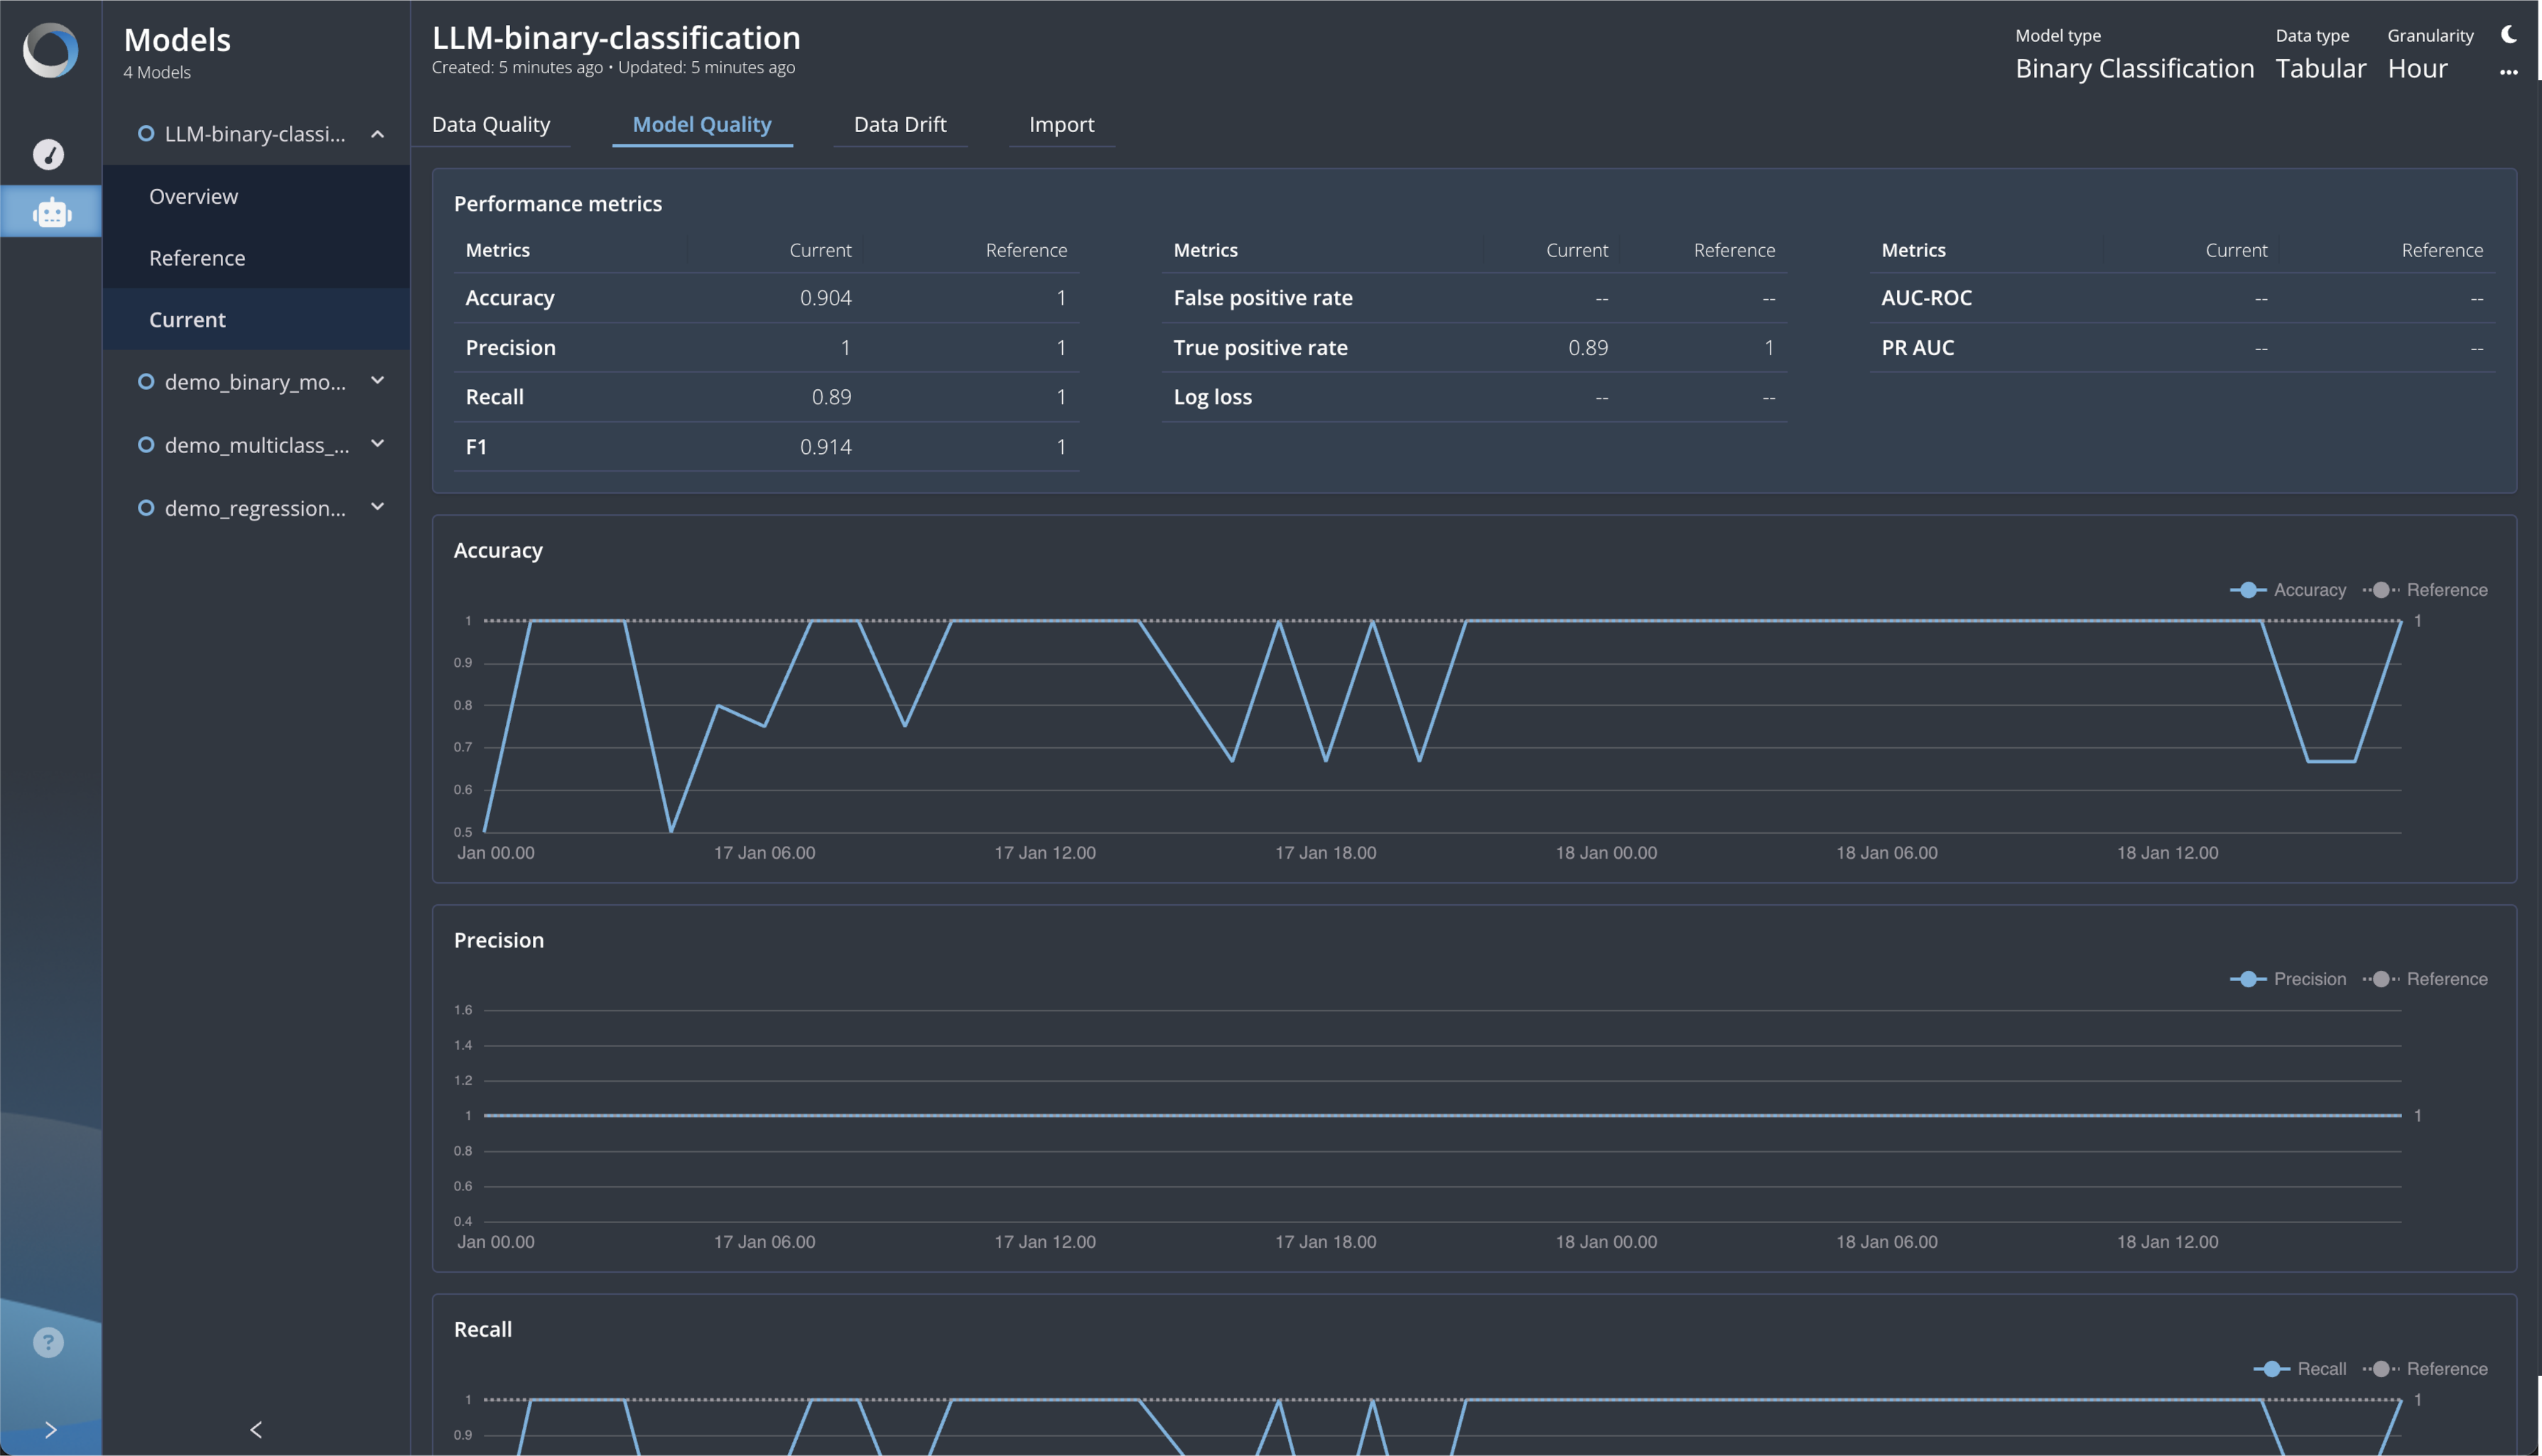
- Model Quality: In this tab, you can compare the model performance between the reference and current datasets. In addition to what you see in the reference model quality, here you can track the metric values over time by aggregating them with a specific granularity (the same you have defined in the Model Creation).
- Model Drift: This tab provides information about potential changes in the data distributions, known as drift, which can lead to model degradation. The drift is detected according to the field type: Chi-square test for categorical variables and Two-Samples Kolmogorov-Smirnov test for numerical ones.
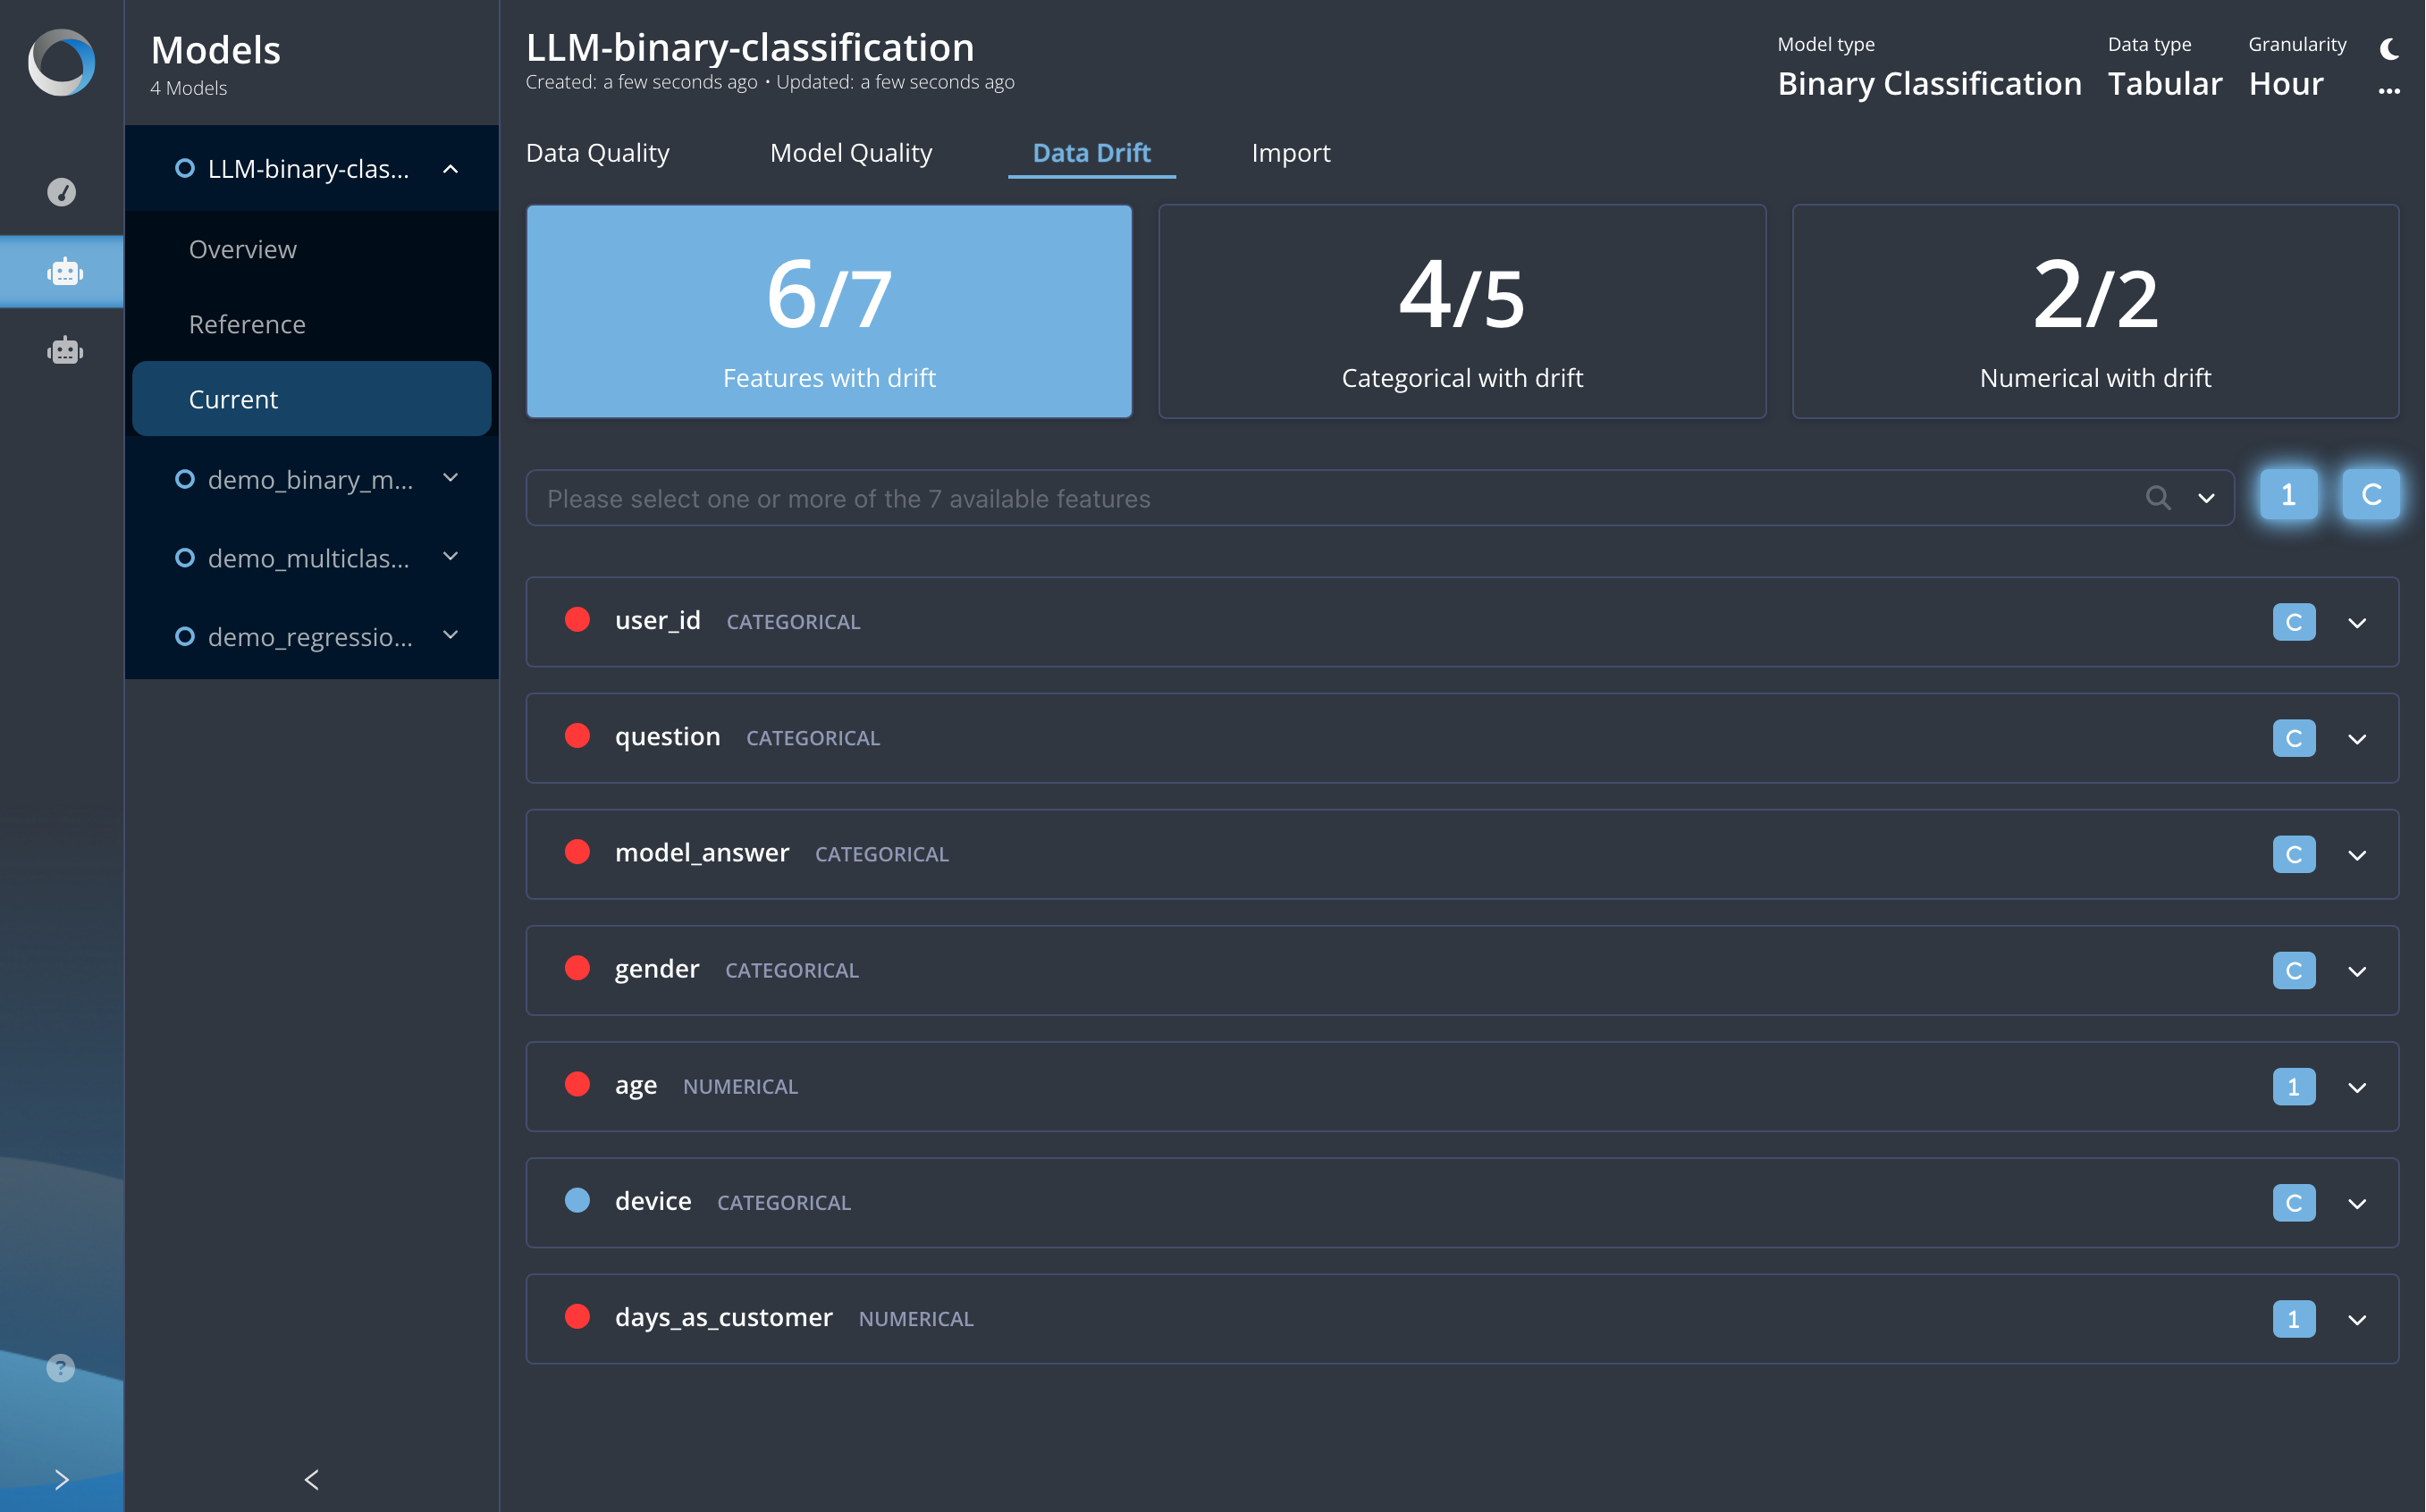
- Import: Here you can list all the current datasets imported over time and switch among them. By default, the last current dataset will be shown.
