Traces
The Traces section provides a detailed log of individual requests or transactions processed by your LLM application. Understanding traces is fundamental to debugging and analyzing your application's behavior and performance.
What is a Trace?
A Trace represents the complete journey of a single request or workflow through your application. Think of it as the end-to-end story of one interaction. For an LLM application, a trace might start when a user submits a prompt and end when the final response is generated. It links together all the steps and services involved in handling that specific request.
What is a Span?
A Span represents a single, logical unit of work within a Trace. It's a named and timed operation, like a specific function call, an API request to an LLM, a database query, or a call to a specific tool. A Trace is typically composed of multiple Spans, often organized hierarchically. For example, a main application span might have child spans for input validation, an LLM call, and response formatting.
By examining the spans within a trace, you can understand:
- How much time was spent in each part of the process.
- The sequence of operations.
- Where errors occurred.
The Traces List View
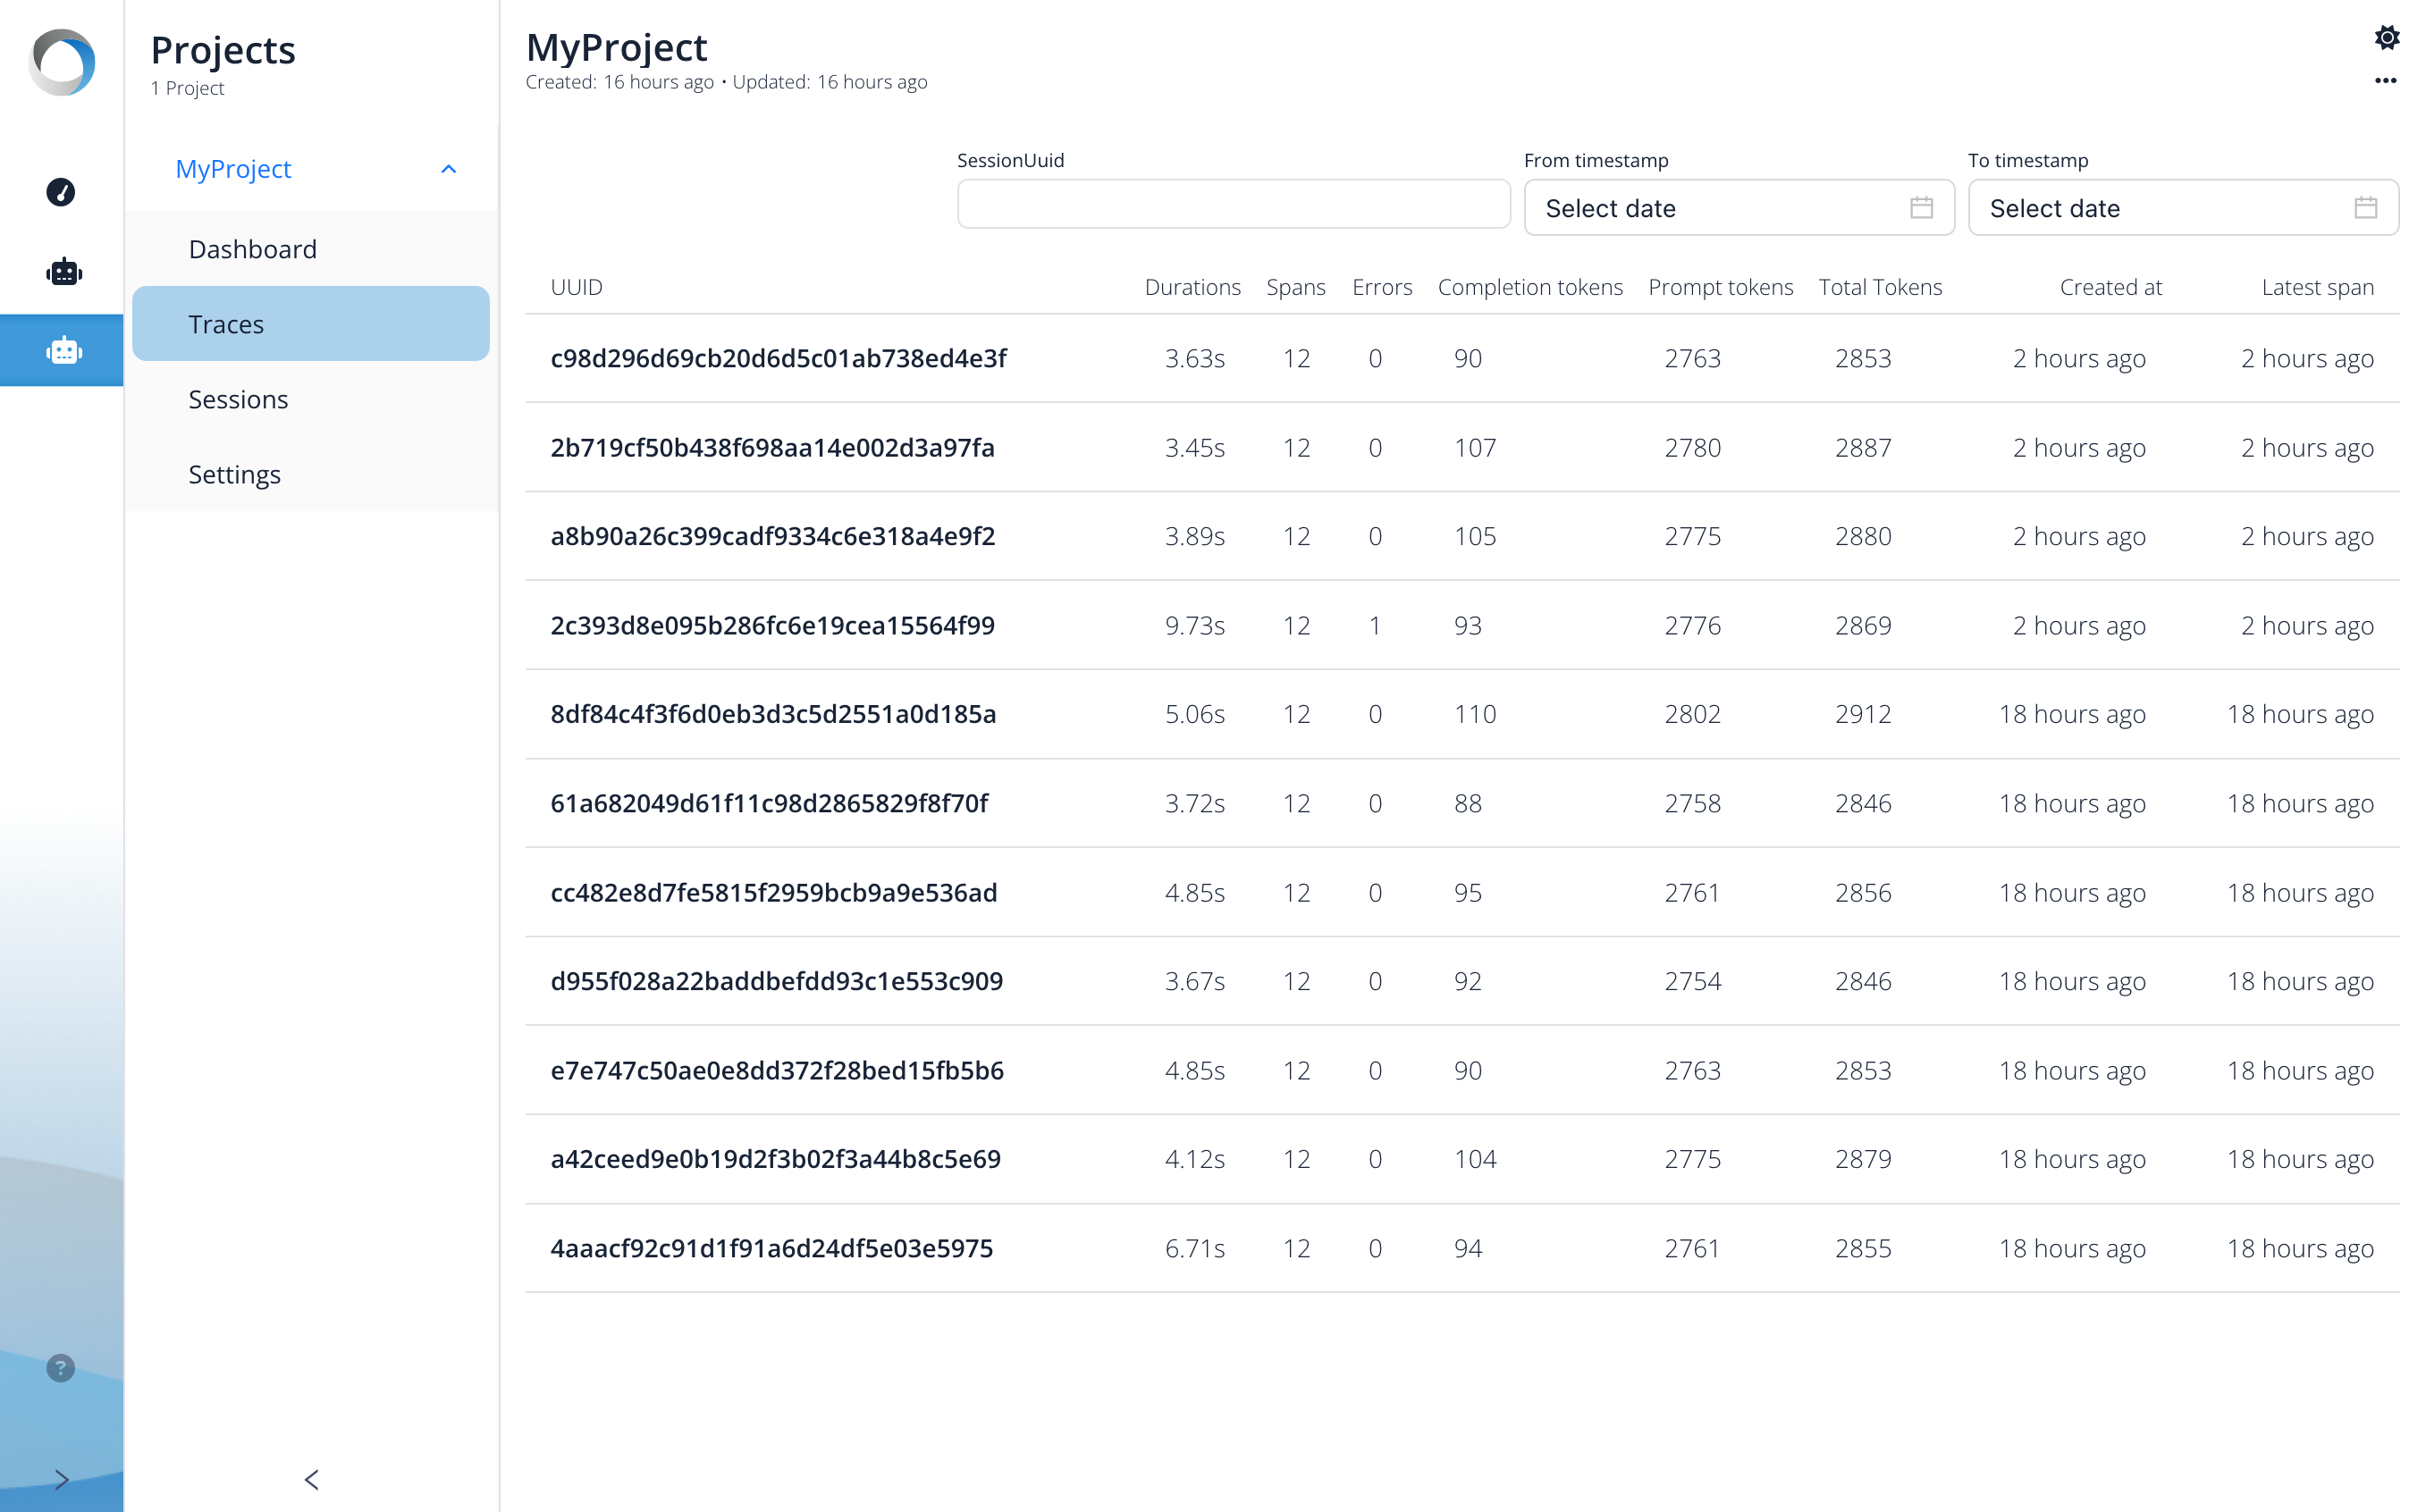
The main view within the Traces section displays a list of all recorded traces, allowing you to browse, filter, and select individual traces for deeper inspection.

Filtering:
At the top of the list, you can filter the displayed traces by:
- Session Id: To view traces belonging to a specific user session.
- From timestamp / To timestamp: To narrow down traces within a specific time window (using the date selectors).
Trace Information:
Each row in the table represents a single trace and provides summary information:
- UUID: The unique identifier for this specific trace.
- Duration: The total time elapsed from the start of the first span to the end of the last span in the trace.
- Spans: The total number of individual spans recorded within this trace.
- Errors: The number of spans within this trace that were marked as having an error.
- Completion tokens: The number of tokens generated by the LLM in response (completion).
- Prompt tokens: The number of tokens sent to the LLM as input (prompt).
- Total Tokens: The sum of prompt and completion tokens, indicating the overall LLM usage for this trace.
- Created at: The timestamp when the trace was first recorded.
- Updated at: The timestamp when the trace was last updated (e.g., when the final span completed).
You can click on a specific trace row (using its UUID) to navigate to a detailed view showing all its spans and associated metadata.
Trace Detail View: Exploring Spans
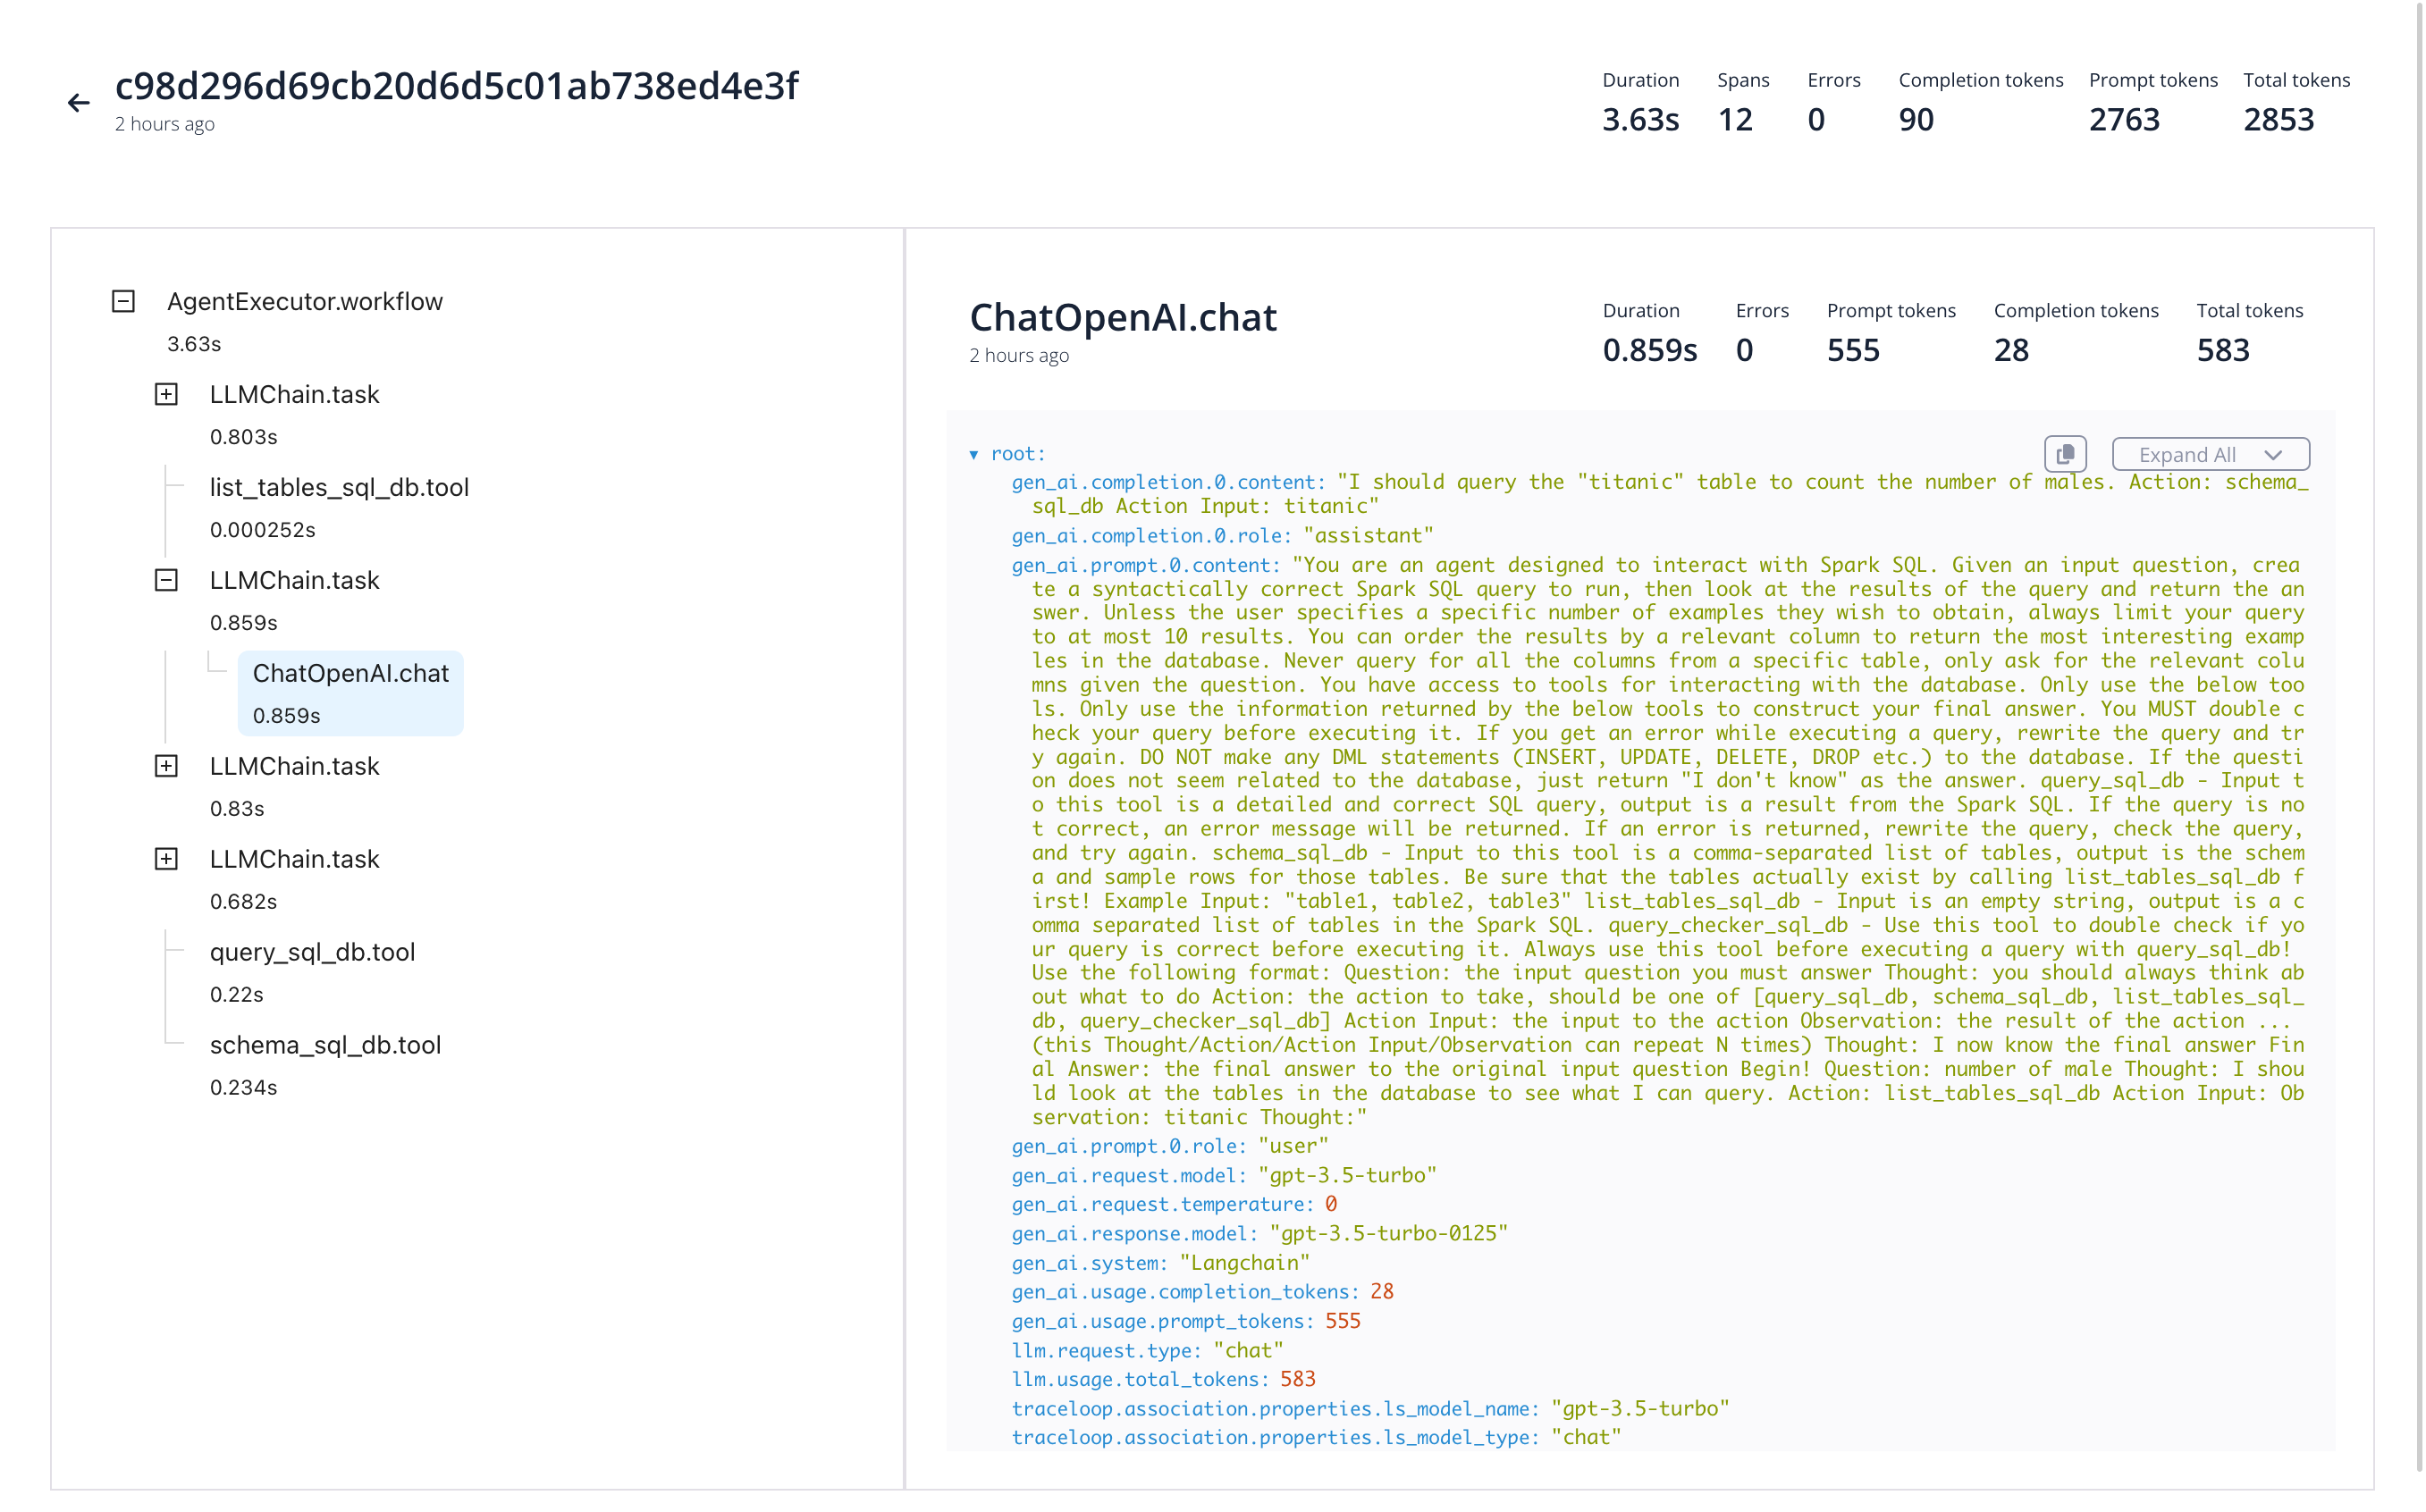
Once you select a specific trace from the Traces list, you are taken to the Trace Detail View. This view provides an in-depth look at the individual operations (spans) that make up the trace, allowing you to understand the exact execution flow and pinpoint issues.

This view is typically divided into two main sections: the Span Tree on the left and the Span Details on the right.
Trace Summary:
At the very top, a summary of the entire trace is displayed, reiterating information like:
- Trace UUID: The identifier of the trace being viewed.
- Duration: The total duration of the entire trace.
- Spans: The total count of spans within this trace.
- Errors: The total count of errors across all spans in this trace.
- Token Counts: Summary of prompt, completion, and total tokens for the entire trace.
1. Span Tree (Left Pane)
This pane visualizes the structure and timing of the spans within the trace:
- Hierarchy: Spans are shown in a nested, tree-like structure. Indentation indicates parent-child relationships. For example,
ChatOpenAI.chatis a child span executed as part of theLLMChain.taskparent span. This hierarchy reflects the call stack or logical flow of your application's execution for this trace. - Span Name: Each entry clearly displays the name of the span (e.g.,
AgentExecutor.workflow,LLMChain.task,ChatOpenAI.chat,list_tables_sql_db.tool). - Duration: The time taken for each individual span to complete is shown next to its name.
- Timeline Visualization (Implied): The structure helps visualize the sequence and nesting of operations. Selecting a span here will update the details shown in the right pane.
This tree structure is very helpful for quickly understanding the sequence of operations, identifying which steps are nested within others, and seeing the duration contribution of each step in the context of its parent.
2. Span Details (Right Pane)
When you select a span from the tree on the left (in the screenshot, ChatOpenAI.chat is selected), this pane populates with detailed information about that specific span:
- Span Header: Shows the selected Span Name (
ChatOpenAI.chat), its individual Duration (0.859s), and potentially error status and token counts specific to this span. - Metadata / Attributes: This is the core section, displaying key-value pairs containing rich information logged for this specific span instance. For an LLM span like
ChatOpenAI.chat, this typically includes:- Inputs:
prompt,prompt.template.content,prompt.input(showing the exact data sent to the LLM). - Outputs:
prompt_completion.content(showing the raw response from the LLM). - LLM Parameters:
prompt_llm.model_name,prompt_llm.temperature, etc. - Usage Metrics:
prompt_llm.request_tokens,prompt_llm.response_tokens,prompt_llm.total_tokensspecific to this LLM call.
- Inputs:
- Controls: You might find utility buttons, such as copy buttons for metadata values or formatting options (like the "Expand All" button shown).
By examining the details of different spans, you can trace data flow, verify inputs/outputs of specific components (like LLMs or tools), and analyze detailed performance metrics for each step.