Launchpad
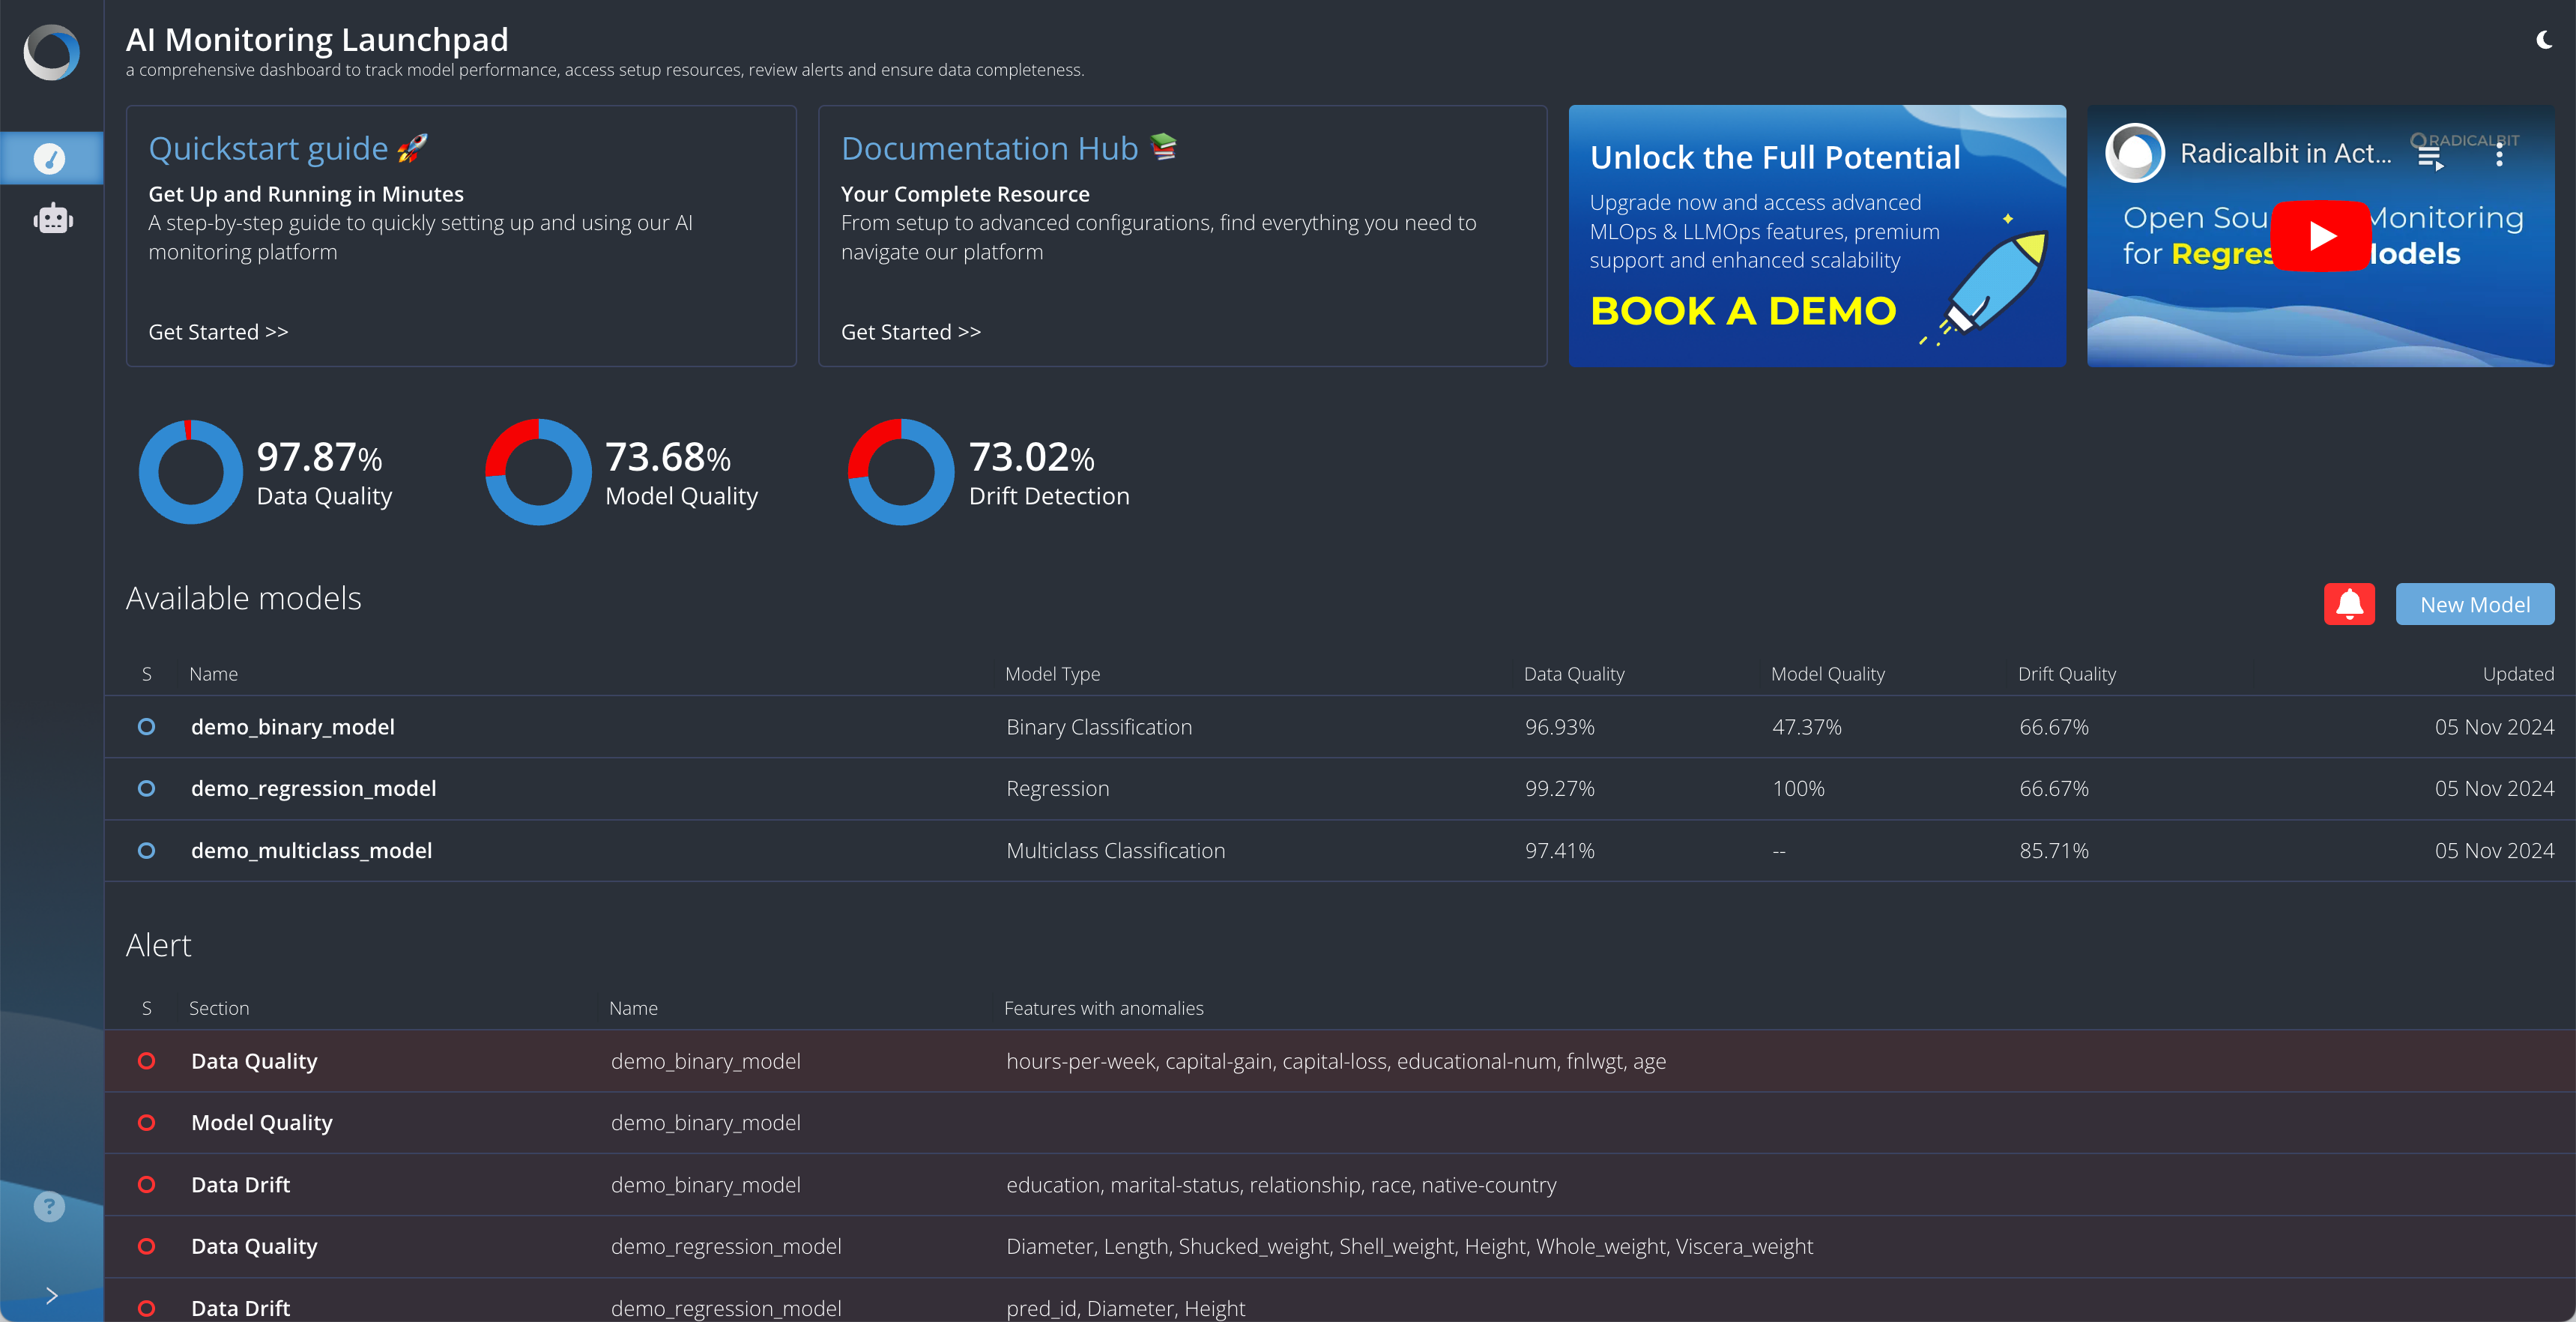
The launchpad provides a dedicated space for summarising existing models.

It offers a quick overview of key aspects:
- Data Quality Percentage: This metric reflects the proportion of columns without anomalies across the current datasets. Anomalies are identified using the Interquartile Range (IQR) method, and the final percentage displayed is the average of each Current’s anomaly-free ratio.
- Model Quality Percentage: This metric is calculated using a Bootstrap Test, based on historical metrics (the same grouped by Timestamp) from the Model Quality page for the current dataset. By grouping metrics over time (e.g., Accuracy), we generate multiple instances of the same metric, forming a statistical population. The Bootstrap Test then compares this population with the metric calculated for the Reference dataset, checking if it falls outside the 95% confidence interval. If so, the metric is flagged as “significantly different” between Reference and Current datasets. This process is repeated for each model metric, and the percentage of metrics that pass the test is returned.
- Drift Detection Percentage: This percentage represents the ratio of features without drift over the total number of features.
NOTE: if a metric cannot be computed, the placeholder
--will be used.
The general pie chart represents the averages of each computed percentage across all models.
Additional information appears on the right side:
- Work in Progress: This section provides real-time updates on model activities, including ongoing and failed jobs.
- Alerts: Here, you’ll find any alerts triggered by the percentages above. When an issue lowers a metric from its ideal 100%, the alert identifies the affected model and component. Clicking the alert takes you to the relevant page for more details.