Overview
The Overview is the section dedicated to the information recap of your reference dataset and your last current dataset, and it helps users to quickly assess the differences and monitor the data shapes.
Summary
The Summary table provides a side-by-side comparison of key metrics between the current and reference datasets:
- Number of variables
- Number of observations
- Missing Values
- Missing Values (%)
- Duplicated rows
- Duplicated rows (%)
- Number of numerical columns
- Number of categorical columns
- Number of Datetime columns

Variables
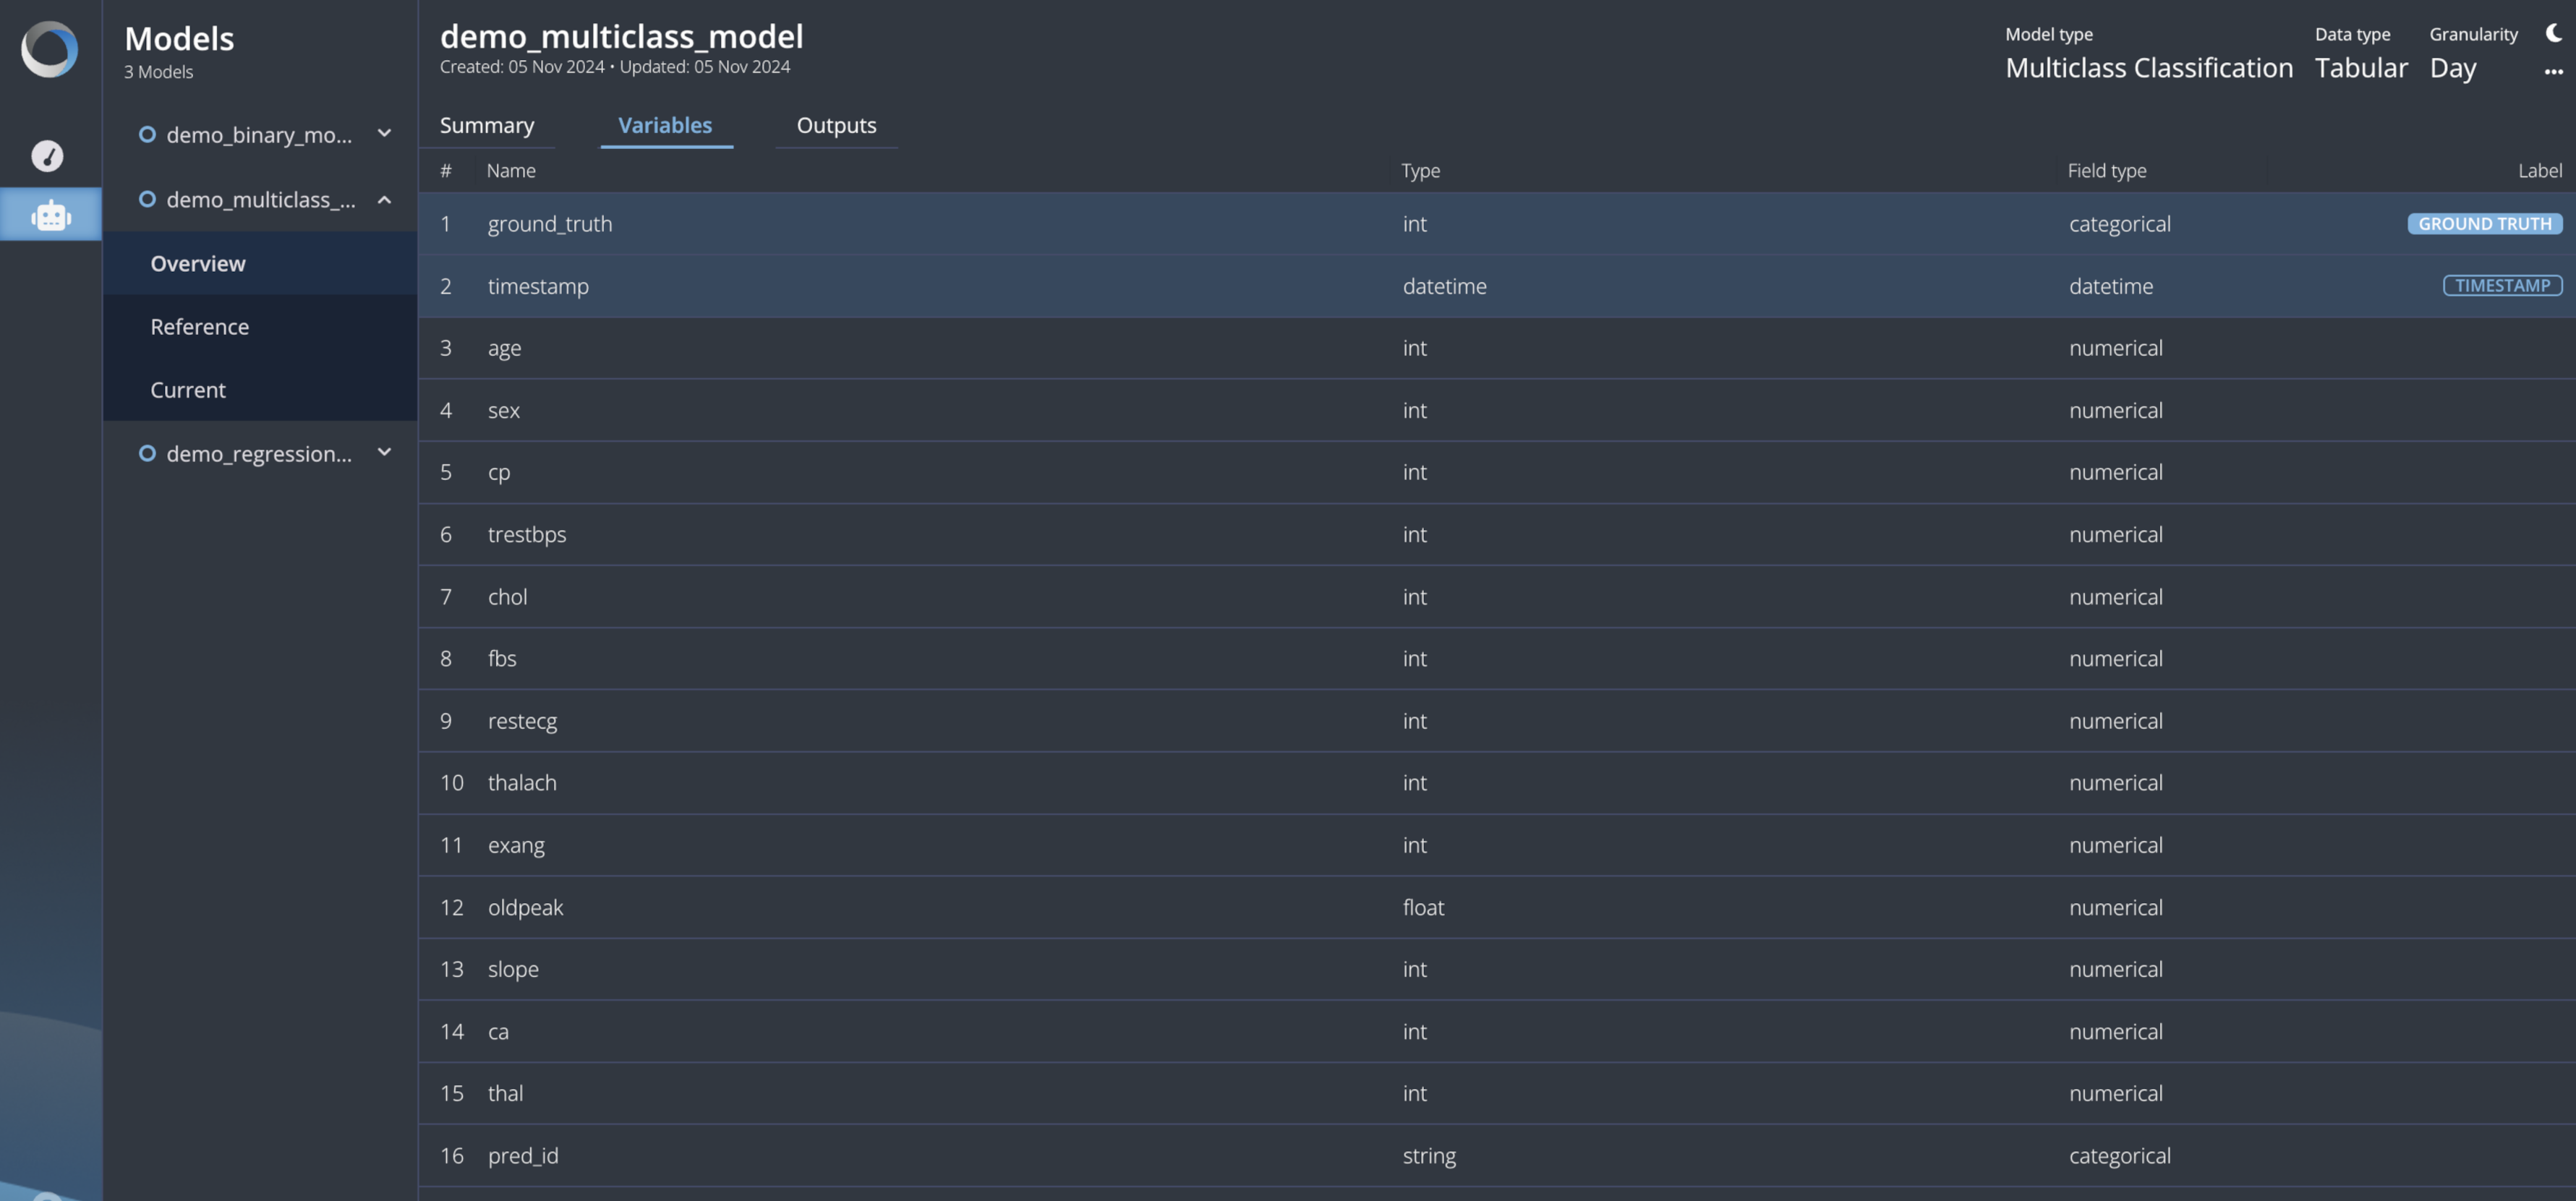
The Variables table lists all the columns flagged as feature or ground truth. That's the reason why we have chosen this name. Each field presents with its own type while the ground truth is flagged properly.
For the meaning of the column Field Type see the Hands-On Guide.

Output
The Output table lists all the columns flagged as probability or prediction and it has to include all the fields produced by your model. Each field presents with its own type while the probability and the prediction are flagged properly.
