Current
The Current section stores all the information (statistics, model metrics and charts) related to the current dataset, placed side-by-side to the reference ones. The objective is to streamline and highlight every difference between the data over time. Throughout the platform, all the current information is coloured blue or in different shades.
NOTE: in this section, you will always see the last uploaded current dataset. In case you need previous current analysis, you can browse among them in the
Importsection.
Data Quality
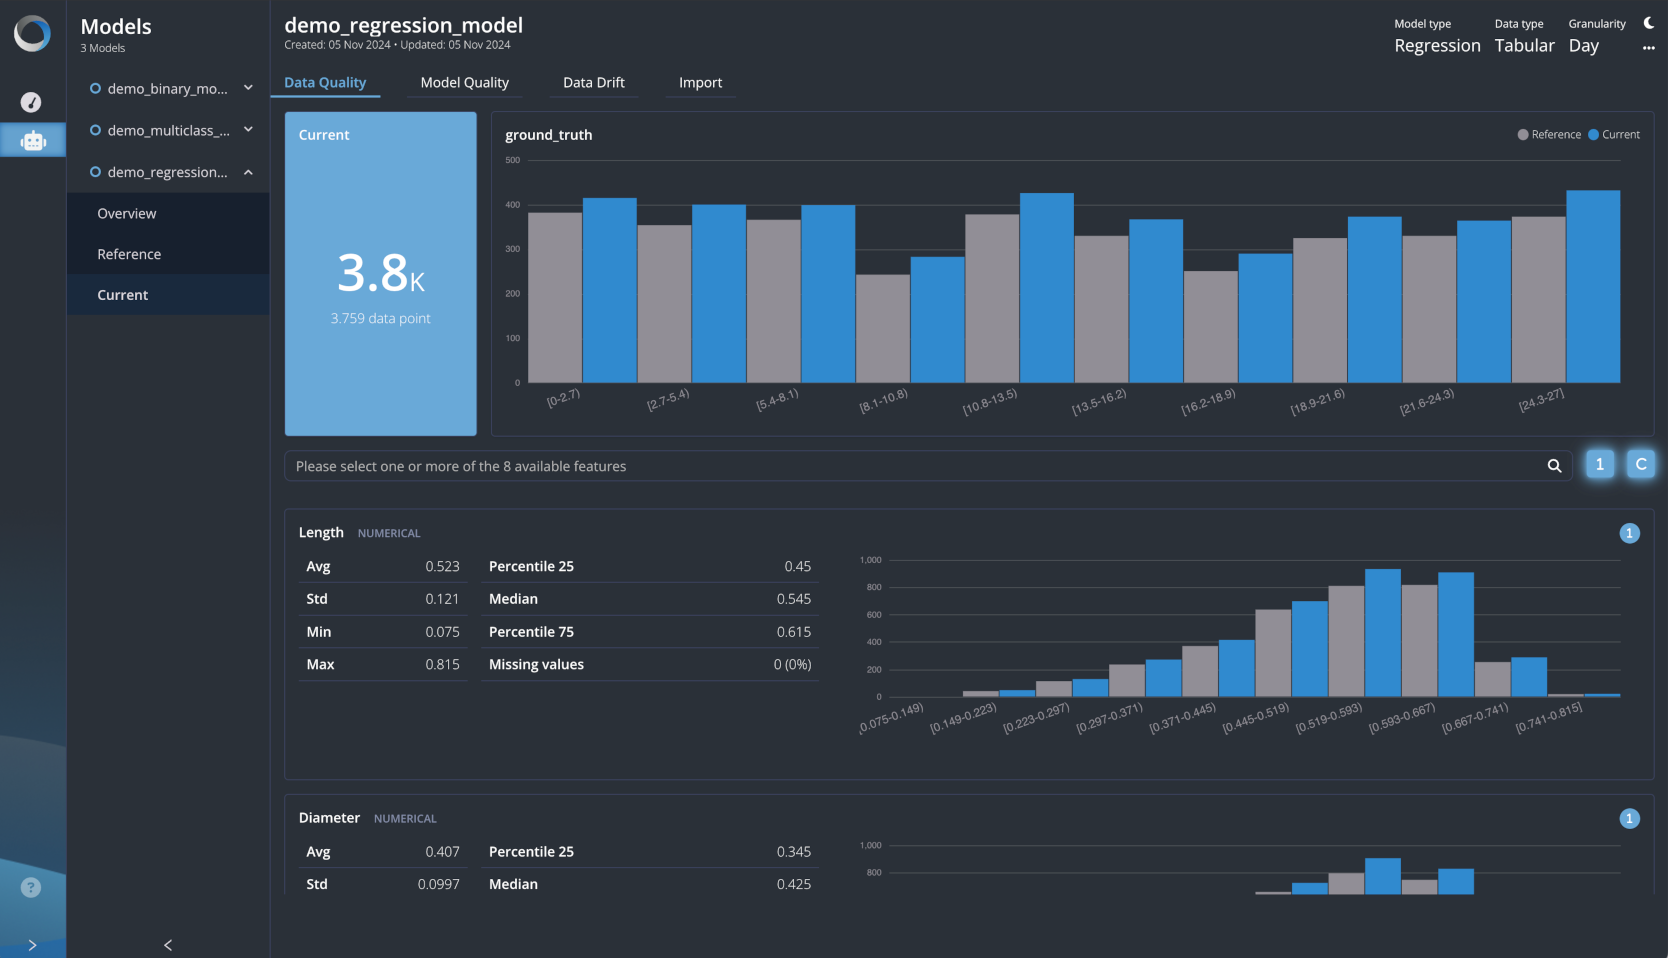
The Data Quality dashboard contains a descriptive analysis of the current variables (blue) placed side-by-side with the reference ones (grey). It adapts itself accordingly to the Model Type and shows information such as:
- Number of observations
- Number of classes (not in regression task)
- Ground Truth Distribution
- Histograms for Numerical Features
- Descriptive Statistics for Numerical Features (average, standard deviation, ranges, percentiles, missing values)
- Bar Charts for Categorical Features
- Descriptive Statistics for Categorical Features(missing values, distinct values, frequencies)

Model Quality
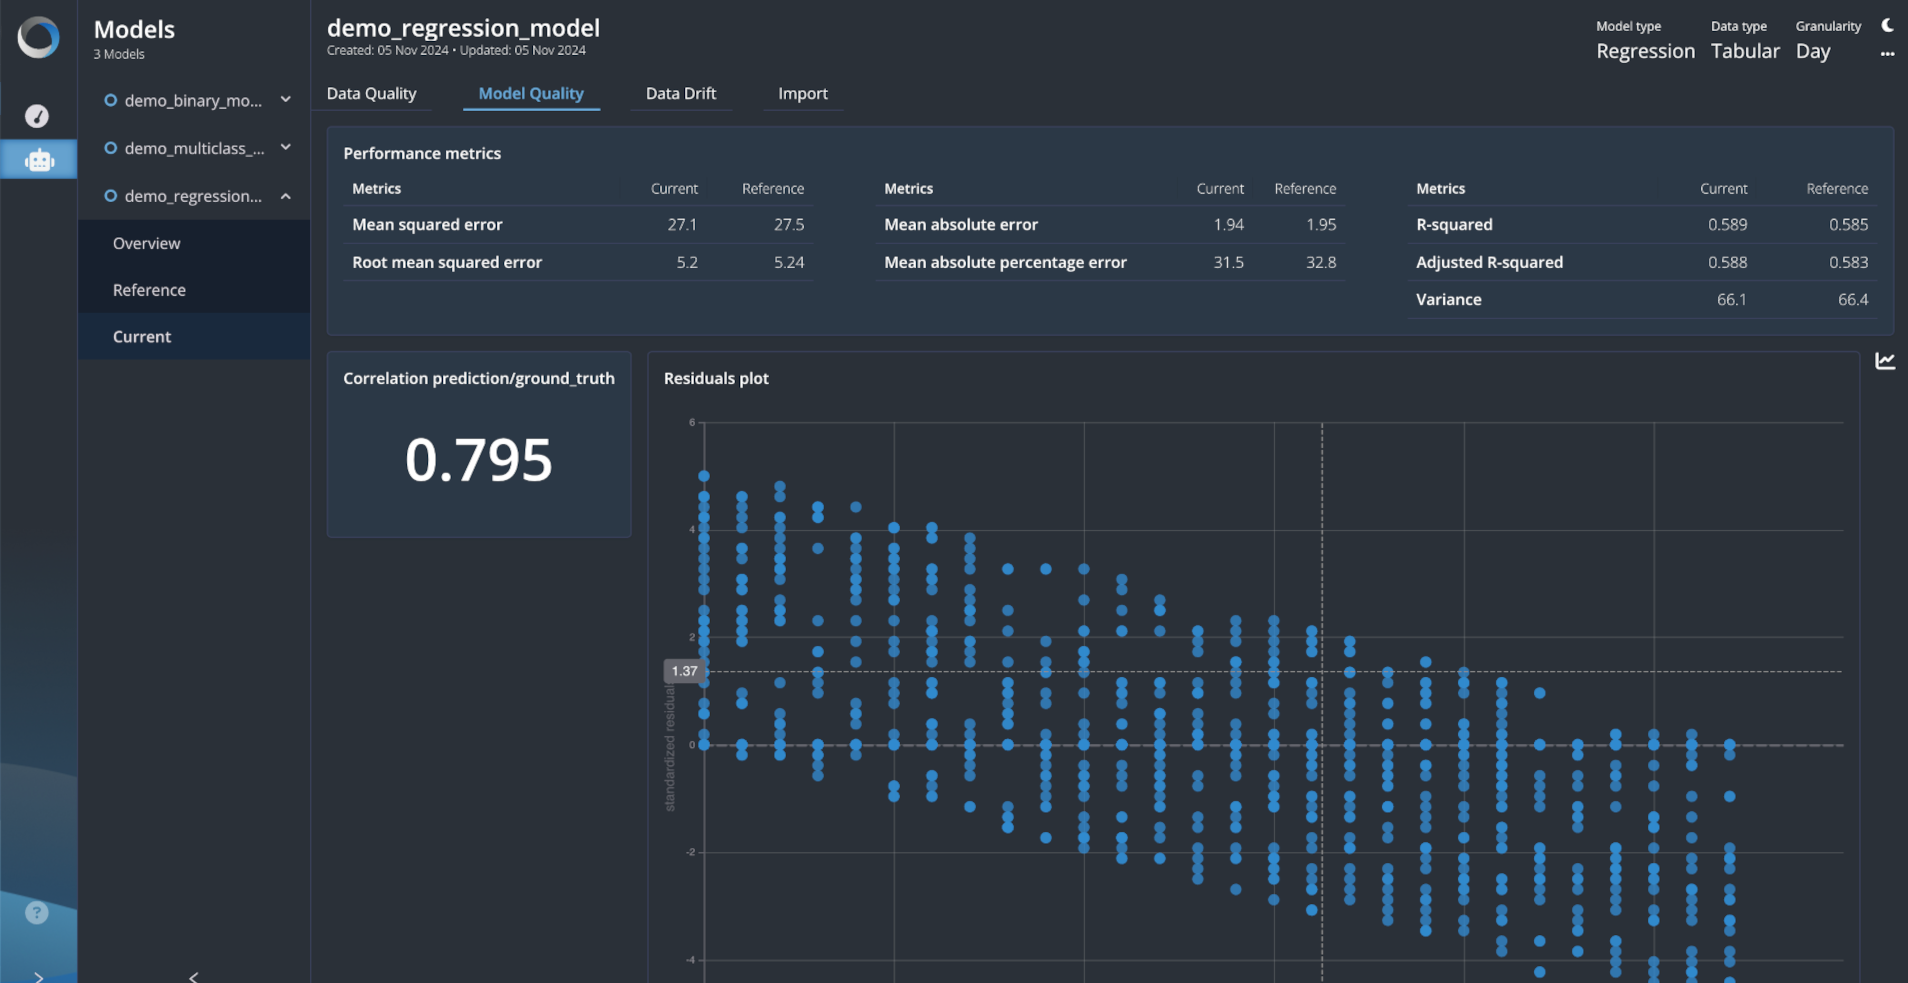
The Model Quality dashboard contains all the metrics used to evaluate the model performance in the current dataset and compare these values to the reference. Many of them are computed through the prediction/probability compared to the ground truth. Naturally, the platform computes the proper metrics according to the chosen Model Type.
Differently from the reference section, here, the metrics are computed over time thanks to the flagged timestamp columns and the granularity parameter chosen during the model creation.

Data Drift
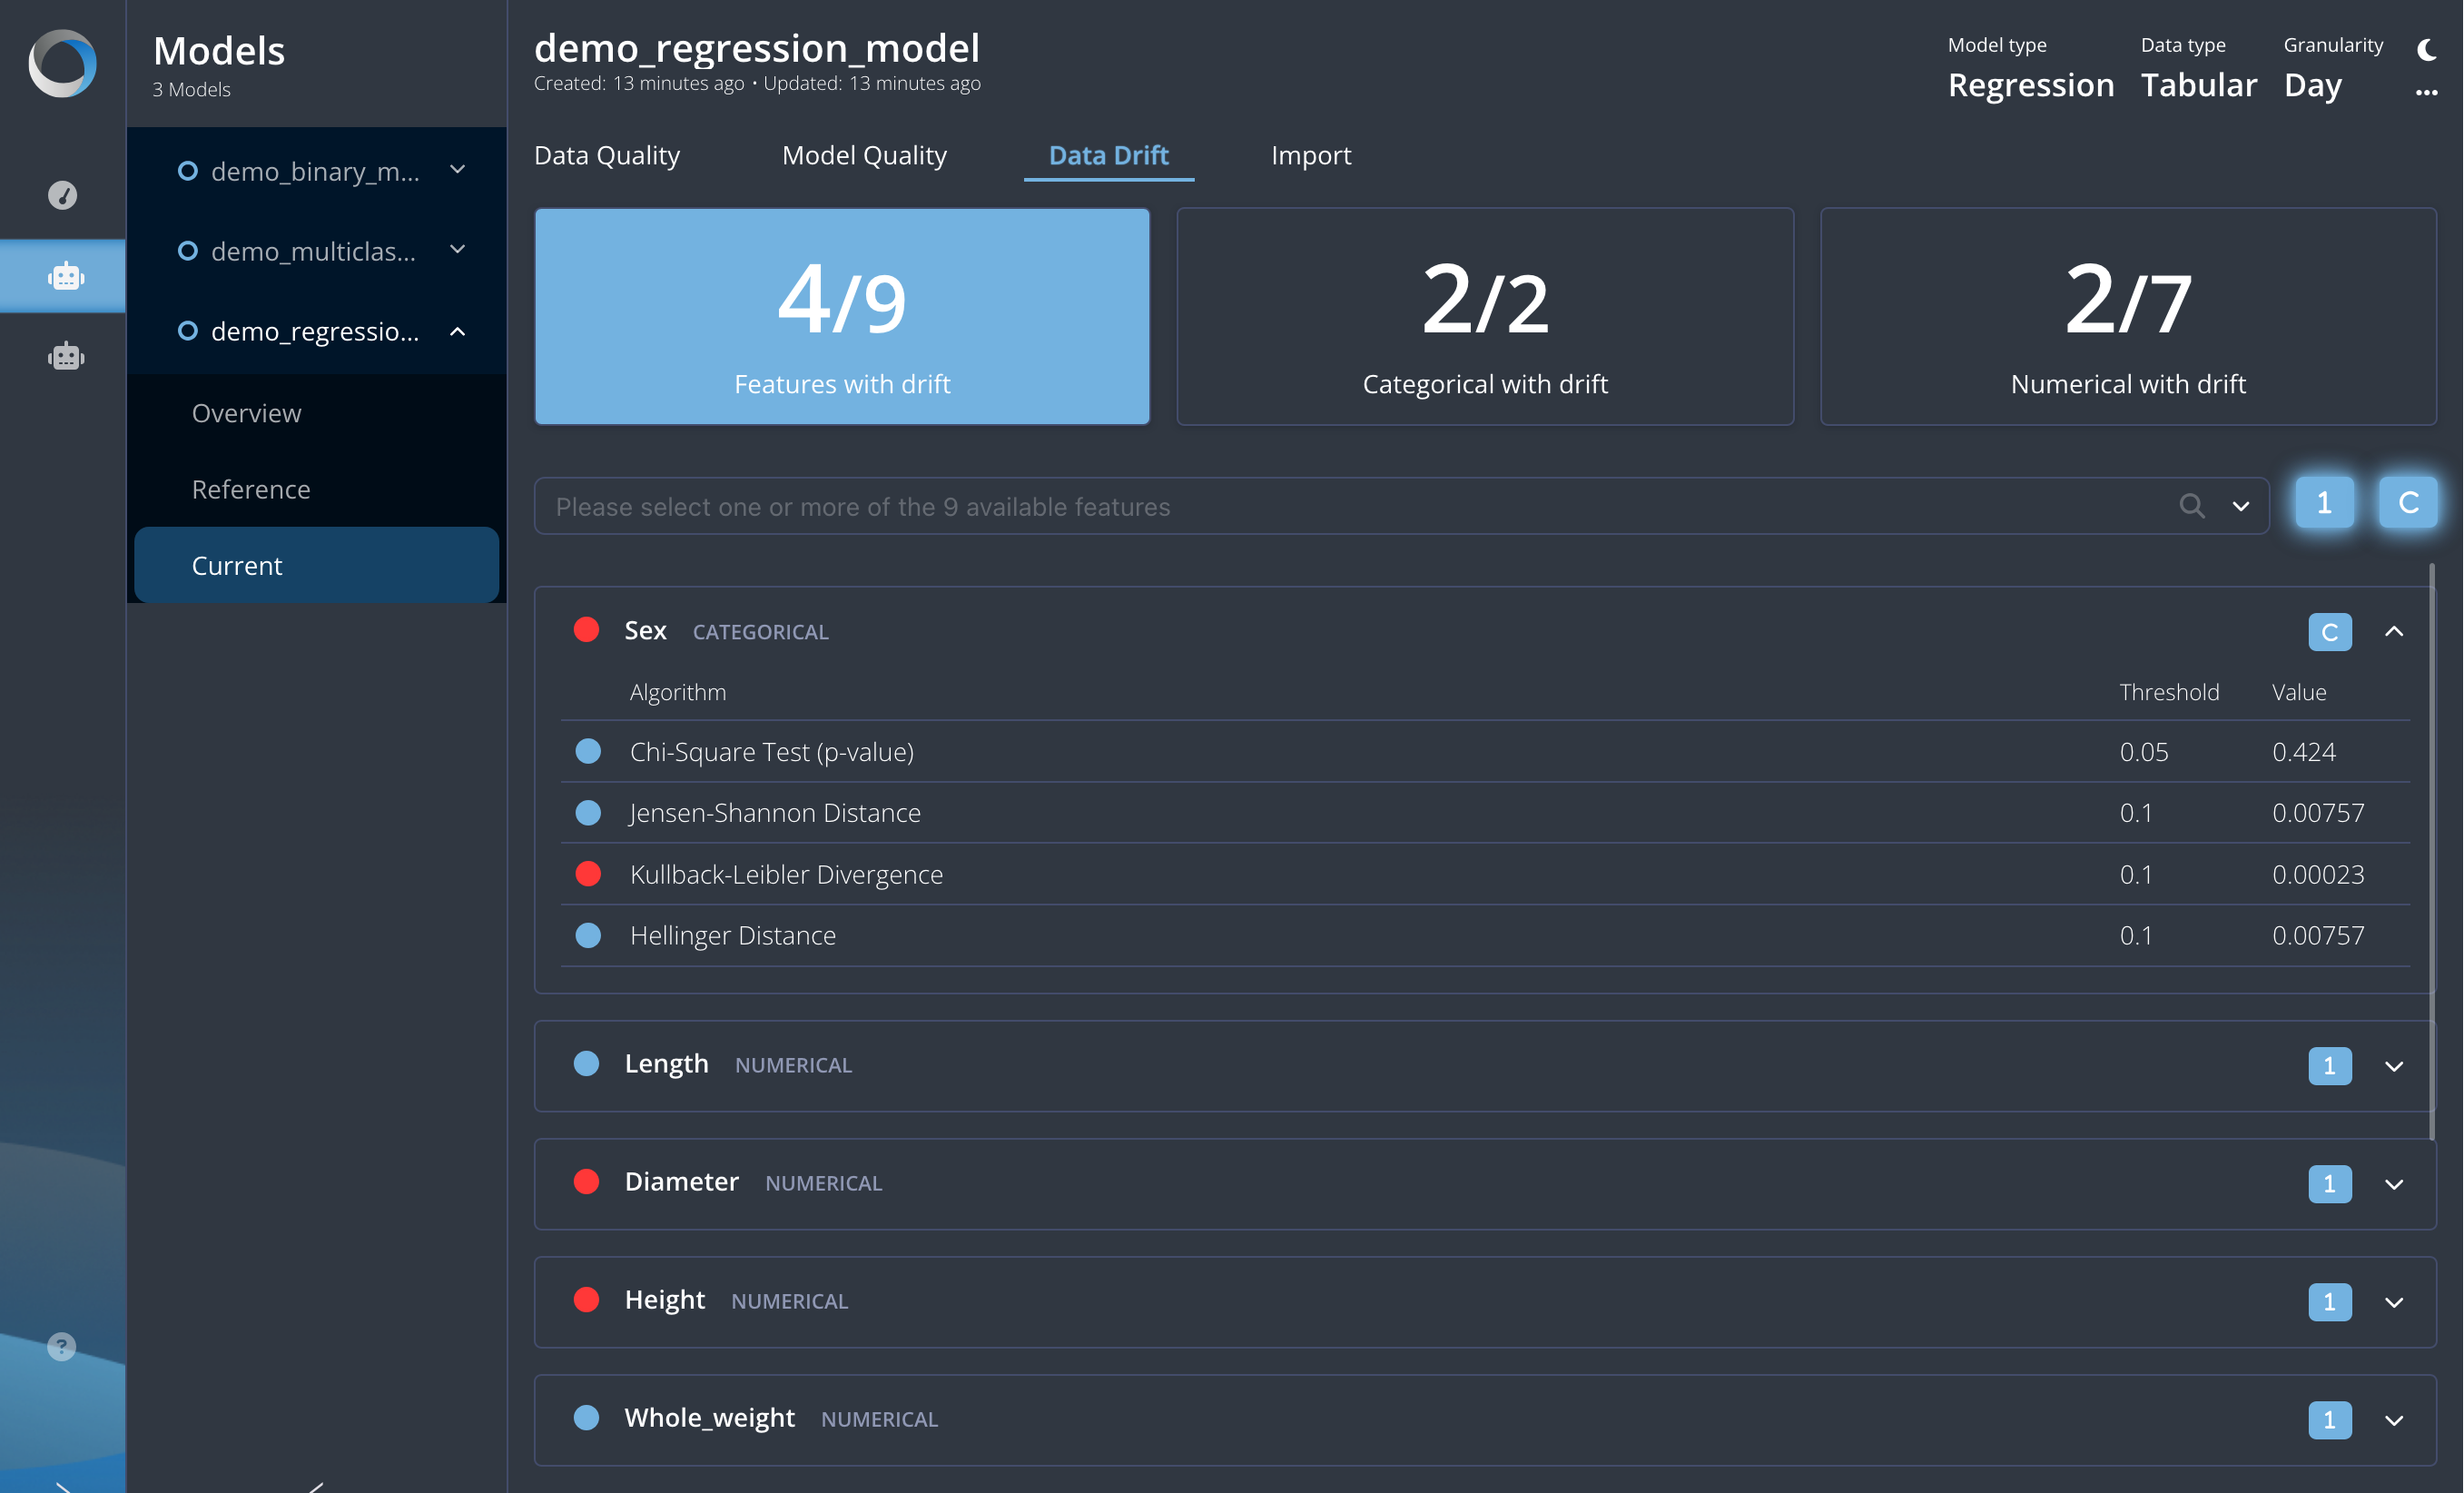
The Data Drift section contains the outcome of some drift detector executed for each variable. According to the field type (categorical or numerical), a specific drift is computed:
- Categoricals:
- Chi-Square Test
- Jensen Shannon Distance
- Kullback-Liebler Divergence
- Hellinger Distance
- Numerical:
- 2-Samples-KS Test (for
floatvariables) - PSI (for
intvariables) - Wasserstein Distance
- Jensen Shannon Distance
- Hellinger Distance
- Kullback-Liebler Divergence
- 2-Samples-KS Test (for
If the dot placed at the side of the variable name is red, it means that at leats one drift has been detected and the relative chart (and statistical description) can be seen in the Current/Data Quality section.
Expand the card to view the drift status for each individual feature. A red dot indicates that drift has been detected for that feature; the calculated drift value and the detection threshold will also be displayed alongside it.
Drift is detected for Jensen Shannon Distance, Kullback-Liebler Divergence, Hellinger Distance, PSI, Wasserstein Distance, and the KS statistic when the calculated value exceeds a predefined threshold. For the Chi-Square test, drift is indicated if the resulting p-value is less than or equal to the chosen significance level.

Import
The Import section lists the path where your current CSVs are stored. If you have a private AWS, the files will be saved in a dedicated S3 bucket otherwise, they will be saved locally with Minio (which shares the same syntax as S3). To see your current datasets stored in Minio, visit the address http://localhost:9091.
Here, you can browse between all the current datasets you have uploaded over time.
